一句话亮点
这篇《Cancer Letters》论文通过多组学整合分析,揭示了转录因子Foxa1作为“总指挥”,通过重塑超级增强子(SE)和三维基因组结构,协同激活耐药基因Rrm1和Cdadc1,驱动胰腺癌吉西他滨耐药;而临床期BET抑制剂AZD5153能拆解这一表观基因组“堡垒”,有效逆转耐药。
背景/痛点
吉西他滨是胰腺癌治疗近三十年的基石药物,但耐药问题几乎注定出现,导致治疗失败。已知的耐药机制——比如药物代谢改变、DNA修复增强——都是“点状”的零散发现。一个关键问题始终悬而未决:这些分散的耐药特征,背后是否存在一个更高层次的、系统性的调控枢纽?
转录因子FOXA1作为先锋因子(Pioneer Factor)能结合紧密染色质并重塑其结构,在多种癌症中与不良预后相关。但它是否、以及如何在三维基因组层面组织起一个耐药“指挥部”,此前并不清楚。
推理链分步拆解
第一步:建立模型,锁定转录组“嫌疑基因”
研究者首先建立了三对来自KPC小鼠模型的亲本(Pa)和吉西他滨耐药(GR)胰腺癌细胞系。耐药细胞IC50飙升了500倍以上,并且对吉西他滨诱导的G0/G1周期阻滞“无动于衷”。
通过RNA-seq,他们画出了耐药细胞的转录组画像:851个基因差异表达,其中435个上调。重点在于,上调基因显著富集在NF-κB、p53、MAPK等“生存通路”上,而一些关键的耐药“老面孔”——如核苷酸还原酶Rrm1和胞苷脱氨酶Cdadc1——赫然在列。这一发现暗示,耐药可能由一个上游的“总开关”同时激活了这些下游效应分子。
@方法论点评:利用同源亲本-耐药对进行组学比较,能有效过滤遗传背景噪音,直接捕捉耐药“获得”过程中发生的转录改变。
接下来,他们自然会问:这些转录变化,是否反映在更上游的染色质层面?

Fig. 1. Gene regulatory underpinnings of gemcitabine resistance in mouse pancreatic cancer cell lines. (A) Three pairs of parental and resistant cells were treated with the indicated concentrations of gemcitabine for 72 h, and cell viability was quantified via the SRB assay. (B) Histograms showing the percentages of cells in each cell cycle phase after treatment with DMSO (Ctrl) or 1 μM gemcitabine (Gem) for 72 h. (C) Ridgeline plot showing the results of gene set enrichment analysis (GSEA) of MSigDB hallmark pathways by comparing gemcitabine-resistant cells to parental cells that had not been exposed to gemcitabine. The color gradient depicts the normalized enrichment score (NES) range varying from dark red (increased in GR) to dark blue (decreased in GR). The x-axis represents the log2-fold change (FC) in gene expression between GRs and PAs determined by mRNA-seq. For cross-species GSEA, mouse and human homologue genes were mapped together on the basis of identical gene symbols via the R package biomaRt (v2.52.0). Only the mouse genes with detectable human homologues were included. (D) Representative GSEA enrichment plots are shown. TNFA signalling via NF-kB and the KRAS signalling pathways that are significantly enriched in GR cells (positive NES) are colored red in (C). MYC target V1 and mTORC1 signalling pathways that are significantly enriched in Pa cells (negative NES) are highlighted in blue in (C). Statistical significance was calculated by the nominal P value of the NES via an empirical gene set-based permutation test. NES, normalized enrichment score. (E) Dot plot depicting the hierarchical arrangement of differentially expressed genes (DEGs) identified between gemcitabine-resistant and parental cell lines. The DEGs are distinguished by various colors, which correlate with their FDR, whereas the diameter of each circle is indicative of log2(FC), where FC represents the fold change. The number of DEGs that were upregulated or downregulated between groups is shown in the plot. (F) Western blot analysis was conducted on Rrm1 and Cdadc1 proteins in 3 paired parental and gemcitabine-resistant cell lines. (G and H) Bar plot illustrating the top 20 KEGG pathways that are significantly enriched in either the upregulated (F, red) or downregulated (G, blue) genes. The pathways are ranked on the basis of a score derived from the negative logarithm base 10 of their respective P values. A polygonal chain in black delineates the gene count associated with each KEGG pathway. (I) The category netplot elucidates the intricate connections between DEGs and a select group of significantly enriched KEGG pathways, which are denoted in red text and symbolized by black dots. The diameter of each dot serves as a visual indicator of the gene count associated with each respective pathway. The DEGs are highlighted in different colors according to their fold change values. (For interpretation of the references to color in this figure legend, the reader is referred to the Web version of this article.)(图注取自PDF文本层,来源:Cancer Letters, 2026)
第二步:ATAC-seq追踪“开锁”痕迹,Foxa1是钥匙?
为了检测染色质的“开闭”状态,他们做了ATAC-seq。结果发现,耐药细胞中有3182个区域染色质开放性增加(Hyper),2063个区域关闭(Hypo)。更重要的是,染色质开放程度的改变与基因表达改变呈强正相关(Pearson r = 0.79)。这意味着,耐药细胞在物理层面上打开了特定基因区域的“门锁”,允许转录机器进入。
随后,他们用HOMER软件对这些新打开的“锁芯”(开放染色质区域)进行了“钥匙”(转录因子结合基序)富集分析。出乎意料又在情理之中的是:Fox家族的基序高度富集。
@方法论点评:ATAC-seq+TF motif分析是一种经典的“从现象到机制”的推理策略,它不预设特定转录因子,而是让数据“告诉”你谁最可能结合在这些关键区域。
在多个富集的Fox家族成员(Foxa1、Foxa2、Foxm1)中,他们进一步发现,只有Foxa1的mRNA和蛋白在耐药细胞中显著上调,且ChIP-qPCR证实其特异性结合在Rrm1和Cdadc1的增强子区域。而敲低Foxa2或Foxm1对耐药表型无影响。于是,Foxa1被锁定为“一号嫌疑人”。
第三步:Foxa1与H3K27ac联手“扩音”,打开远距离增强子
既然锁定了关键“钥匙”,他们就需要证明这把“钥匙”确实打开了“锁”,并且开启了“扩音器”(增强子)。
他们进行了Foxa1的ChIP-seq,并同时检测了激活型组蛋白修饰H3K27ac和抑制型修饰H3K27me3。结果清晰:在耐药细胞中,Foxa1结合增加的区域(GAIN)与H3K27ac增加的区域高度重叠,且它们都富集在基因间区的远距离增强子位置。
进一步的整合分析显示:Foxa1结合 → 染色质开放 → H3K27ac富集,这三者协同作用,精准调控了Rrm1和Cdadc1等耐药基因的“音量”放大。
@方法论点评:多组学数据的整合是本文的“杀招”。通过Pearson相关性分析(r值均大于0.7),他们证明了Foxa1、H3K27ac、染色质开放性与基因表达之间存在强大的协同关系,而非简单的伴随现象。
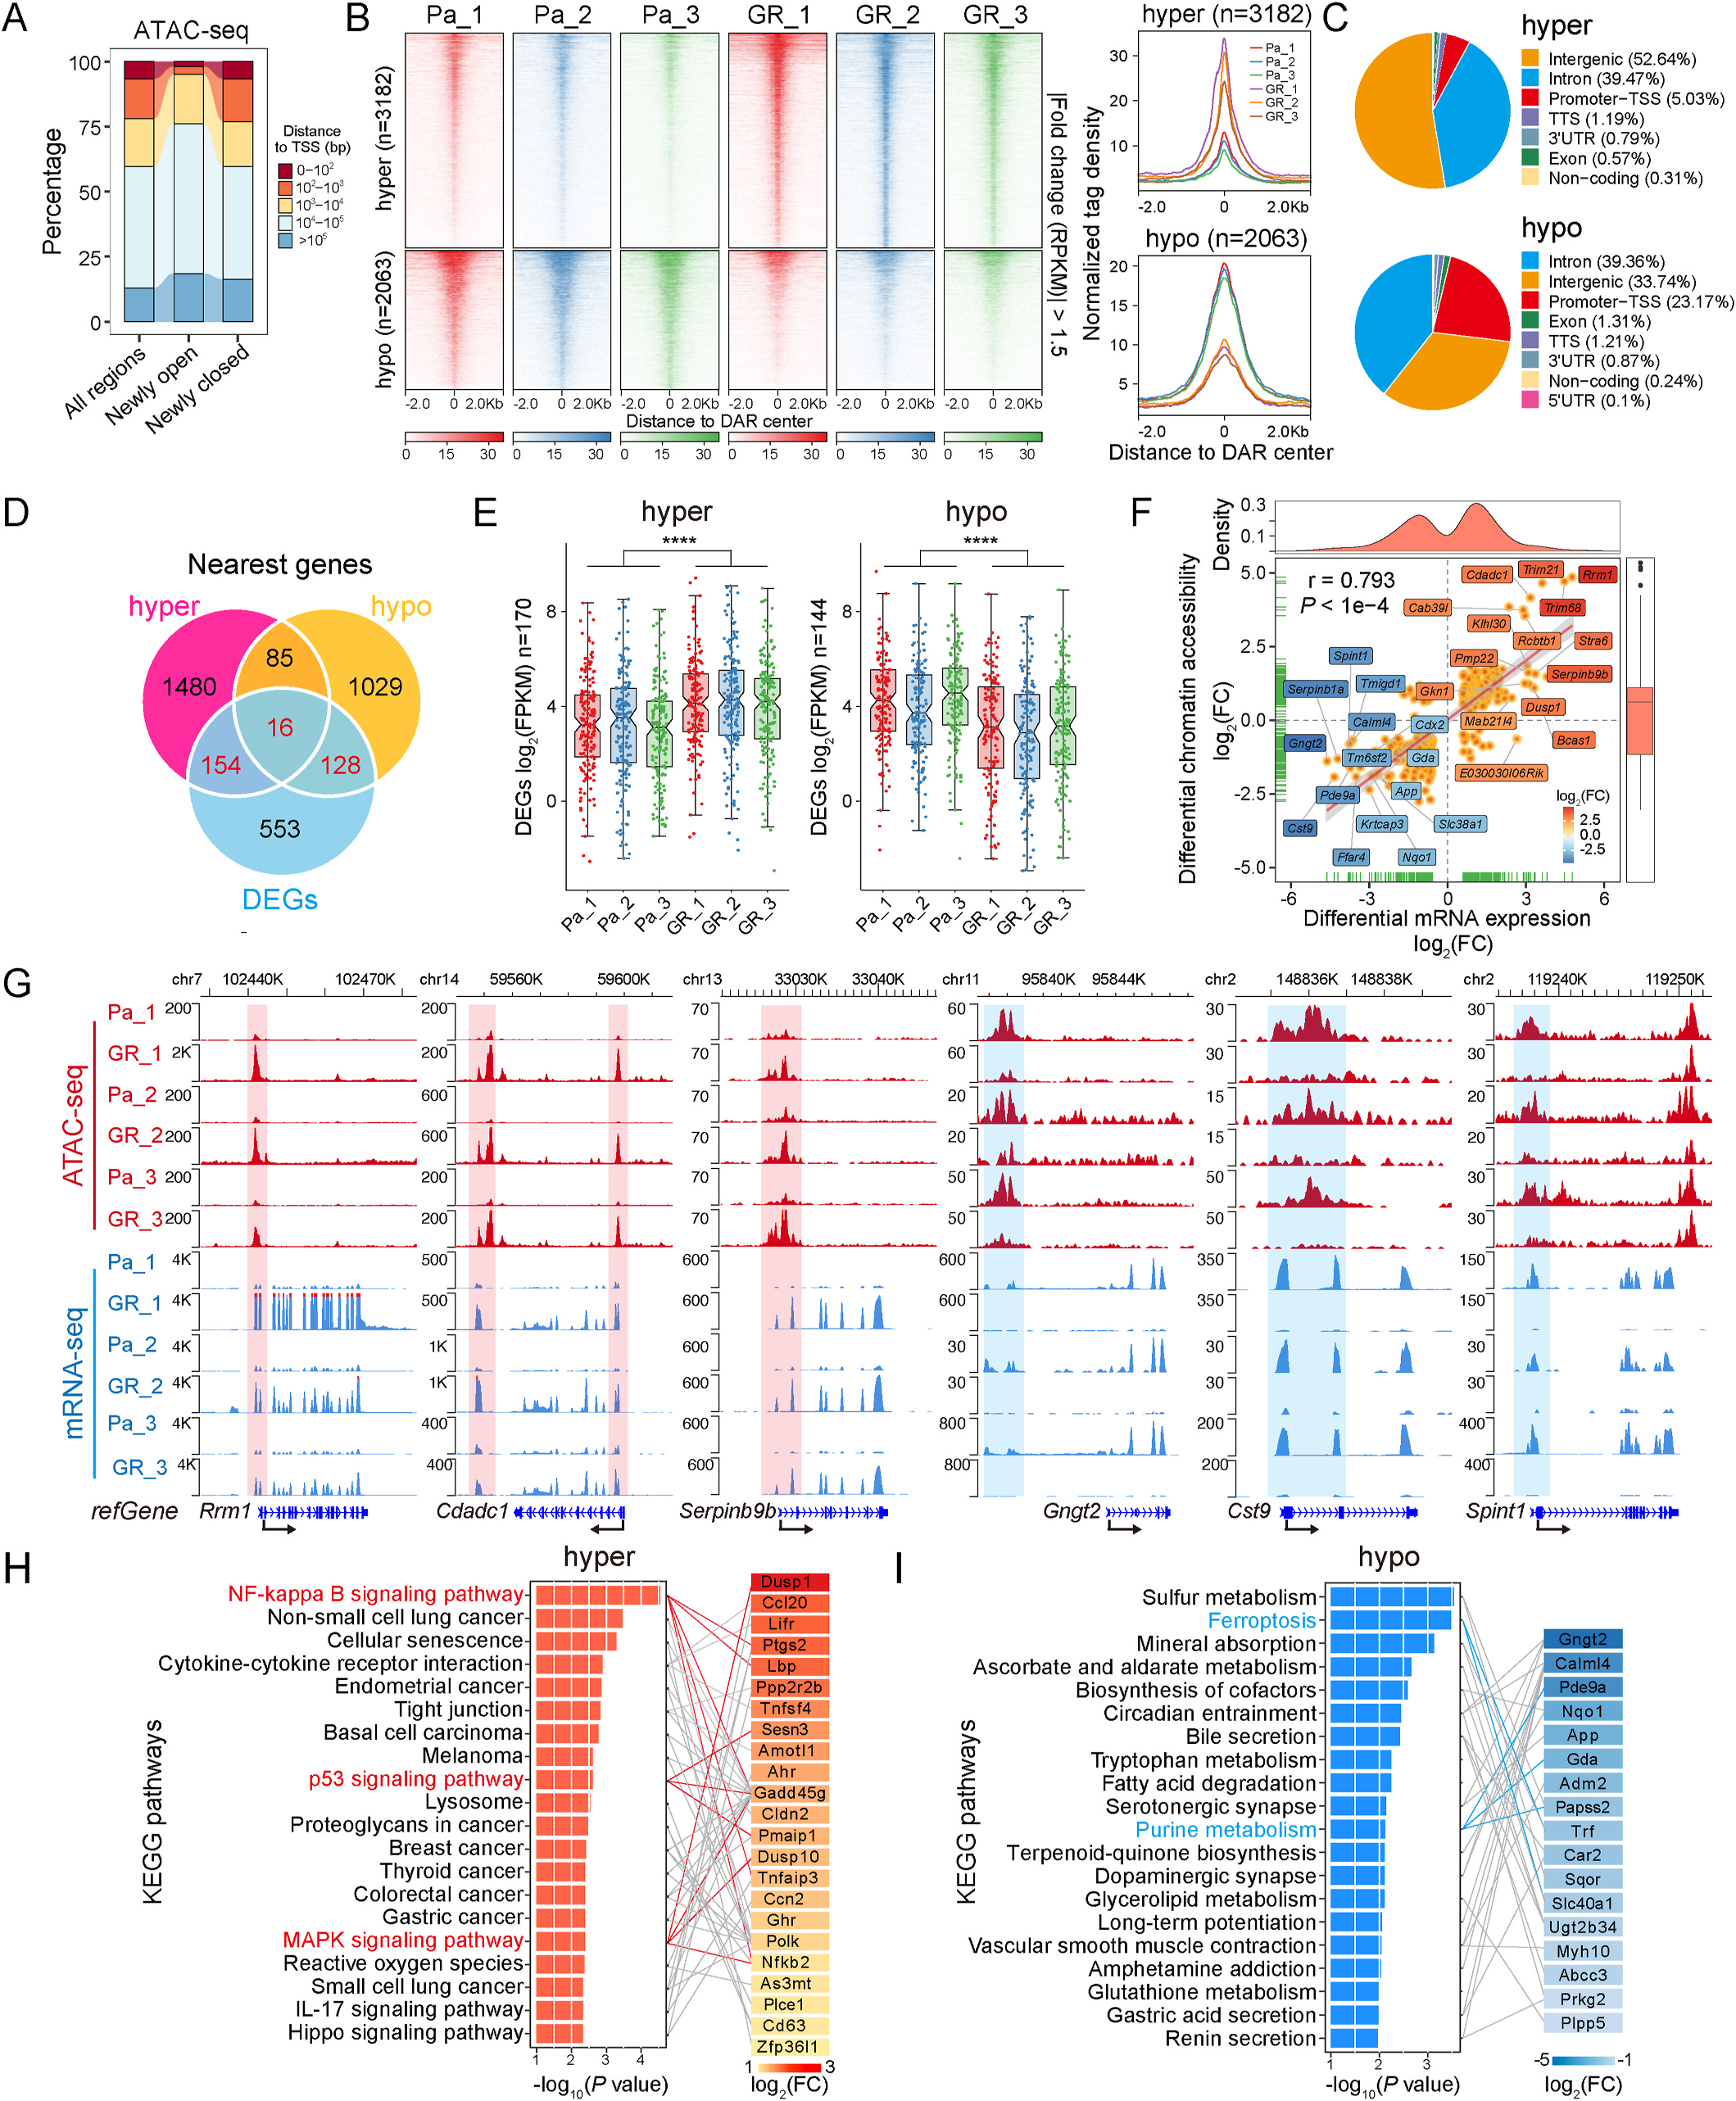
Fig. 2. Genome-wide changes in chromatin accessibility are positively correlated with differential gene expression patterns in resistant cells. (A) Distance to the closest transcription start site (TSS) of newly opened (hyper-accessible) and closed (hypo-accessible) regions in gemcitabine-resistant cells compared with parental cells and all accessible regions in both cell lines. (B) Heatmap (left) representation of normalized ATAC-seq signals in parental and gemcitabine-resistant cells compared with DARs. The top panel shows read signals over the 3182 hyper-accessible regions in GR cells, whereas the bottom panel shows read signals over the 2063 hypo-accessible regions. The signals are displayed from −2 Kb to +2 Kb surrounding the center of the DARs in descending order. Profiles (right) of normalized tag density across a genomic window of 2 kb flanking the center of hyper-accessible (top) and hypo-accessible (bottom) regions. Kb, kilobase. (C) Pie chart showing the proportions of hyper-accessible (top) and hypo-accessible (bottom) sites within the indicated genomic regions: introns, exons, intergenic regions, 3′ UTRs, 5′ UTRs, promoters-TSSs, TES (transcription end sites) and noncoding regions. The region centers located up to 1 kb upstream and 1 kb downstream of the TSS are considered the promoter-TSS region. (D) Venn diagram illustrating the intersection among DEGs and the nearest genes of hyper- or hypo-accessible regions. (E) Box plots of the mRNA expression levels (log2FPKM) of DEGs related to differentially accessible regions. Notches of the boxes indicate medians. Statistical significance was calculated by the Wilcoxon signed-rank test, P < 0.0001. (F) Correlation analysis between DARs and their nearest DEGs. Each orange-colored dot represents a gene that is significantly differentially expressed and associated with changes in chromatin accessibility. The top- or bottom-ranked 10 DEGs are labelled and shown in different colors on the basis of the log2(FC) of the average FPKM. Pearson’s correlation coefficient (r = 0.79) and its corresponding P value are shown in the plot. (G) The WashU Epigenome Browser tracks display ATAC-seq (red) and mRNA-seq (blue) signals for representative up- and downregulated genes. Hyper-accessible regions are highlighted in red, whereas hypo-accessible regions are shaded in blue. The dark blue arrow adjacent to the gene name indicates the direction of transcription. (H and I) Bar plot showing significantly enriched KEGG pathways and their corresponding DEGs related to hyper-accessible (H) and hypo-accessible (I) regions. DEGs are highlighted with different background colors on the basis of the log2-fold change in average FPKM values. (For interpretation of the references to color in this figure legend, the reader is referred to the Web version of this article.)(图注取自PDF文本层,来源:Cancer Letters, 2026)
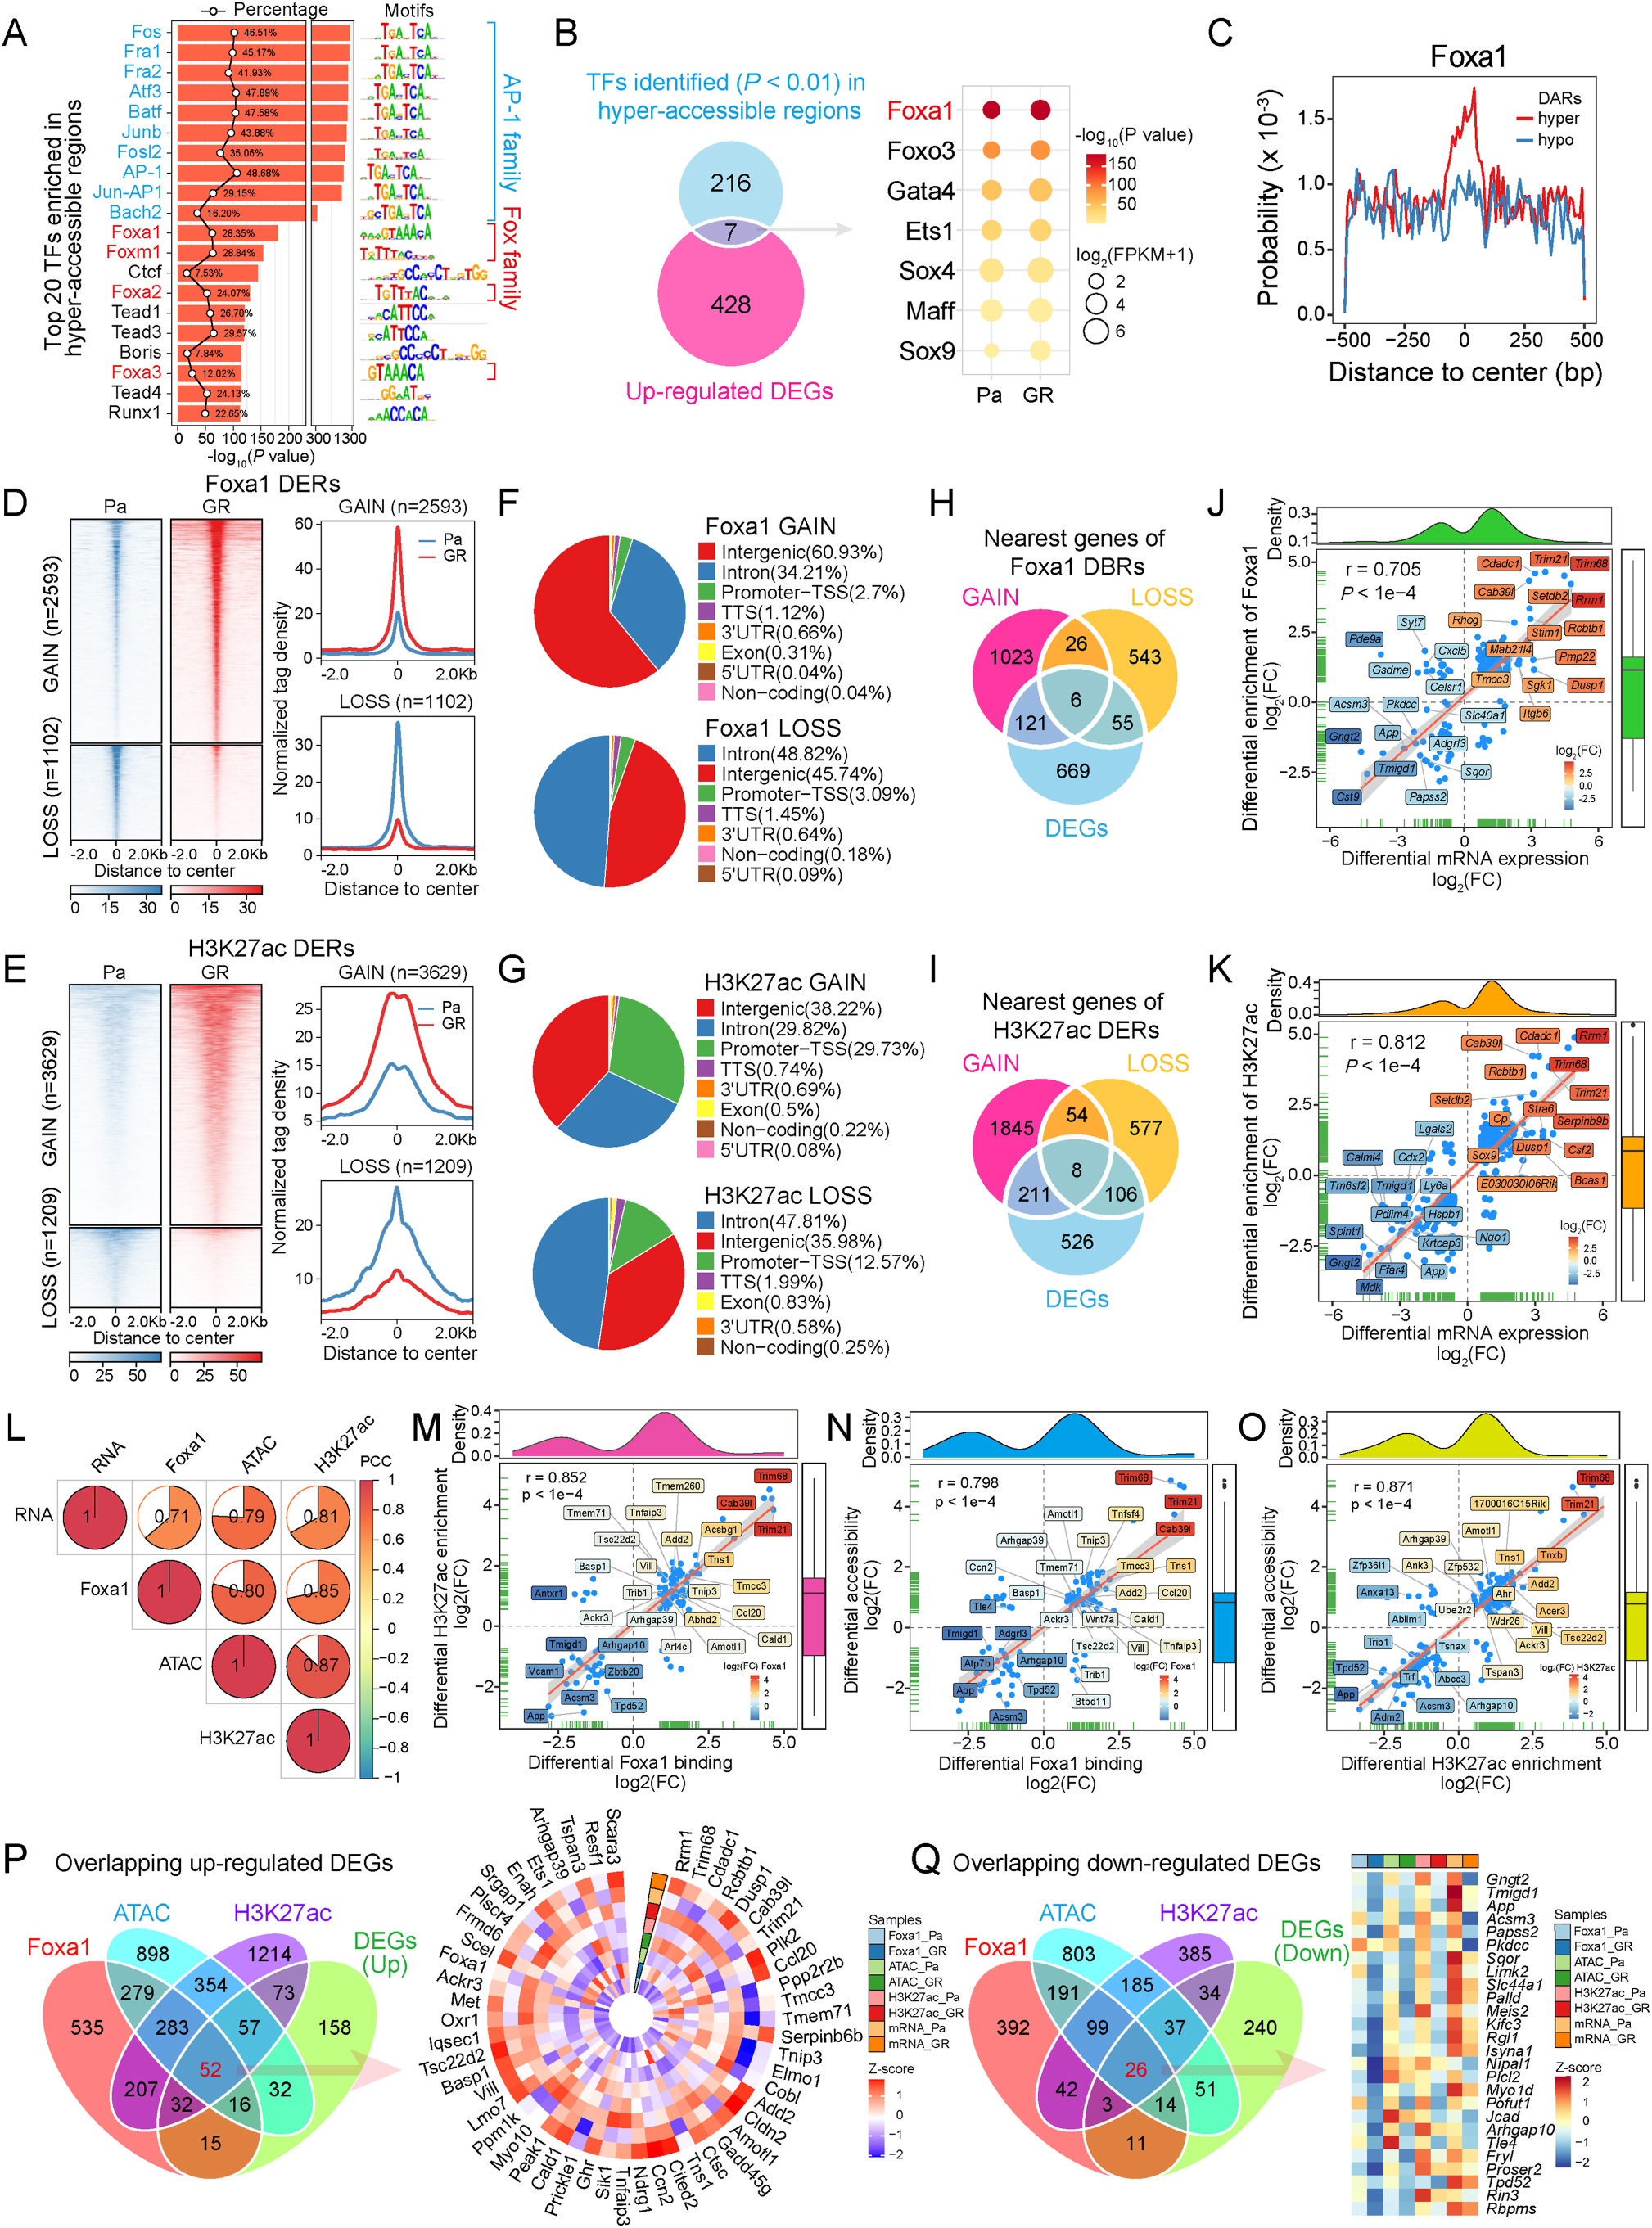
Fig. 3. Alterations in chromatin accessibility, Foxa1 binding and H3K27ac modification coordinately regulate the differential gene expression implicated in gem citabine resistance. (A) Top 20 enriched known TF motifs of hyper-accessible sites. The members of the AP-1 and Fox TF families are colored blue and red, respectively. The polygonal chain in black shows the percentages of target sequences with TF motifs. (B) Venn diagram showing the intersection between TFs predicted to be enriched (P < 0.01 b y default) in hyper-accessible regions and upregulated DEGs. The dot plot highlights the upregulated TFs in hyper-accessible regions. The color of each dot signifies the P value of enrichment for each motif and cell type, whereas the size of each dot corresponds to the gene expression level of the TFs associated with the enriched motif. (C) The occupancy probability of the transcription factor Foxa1 within DARs is depicted. (D) Heatmap (left panel) and profile plots (right panel) illustrating changes in the Foxa1 ChIP-seq signal in Pa and GR cells over the GAIN (top panel, n = 2593) or LOSS (bottom panel, n = 1102) regions. The signals are ordered in descending magnitude within a ±2 kb window centered on the differential binding regions (DBRs) of Foxa1. (E) Heatmap and profile plots showing changes in H3K27ac ChIP-seq signals in Pa and GR cells over the GAIN (top panel, n = 3629) or LOSS (bottom panel, n = 1209) regions. The signals are displayed in descending order within a region spanning ±2 kb around the center of the differentially enriched regions (DERs) of H3K27ac. (F and G) Genomic annotations of the GAIN and LOSS regions according to the peak locations of Foxa1 DBRs (F) and H3K27ac DERs (G). (H and I) Overlap among DEGs and the nearest genes of the GAIN or LOSS regions for Foxa1 DBRs (H) and H3K27ac DERs (I). (J and K) Correlation analysis between differential Foxa1 binding (J) or H3K27ac enrichment (K) regions and their nearest DEGs. The blue dots represent DEGs linked to alterations in Foxa1 binding or H3K27ac enrichment. The top- and bottom-ranked 10 DEGs are labelled and shown in different colors on the basis of the log2(FC) of the average FPKM. The Pearson correlation coefficient (PCC, r) and the corresponding P value are also shown. (L) The Pearson correlation coefficient is displayed among the differential multi-omic signals of RNA, ATAC-seq, Foxa1 ChIP-seq, and H3K27ac ChIP-seq. (M −O) Correlation analysis of differential Foxa1 binding, H3K27ac enrichment, and chromatin accessibility. The top- and bottom- ranked DEGs are labelled and displayed in distinct colors according to the log2(FC) of the average FPKM. The Pearson correlation coefficient and the corresponding P value are also indicated. (P and Q) Venn diagram (left panel) and heatmap (right panel) representing the overlap among up- (O) and downregulated (P) DEGs and the nearest genes of chromatin DARs, Foxa1 DBRs, and H3K27ac DERs. Gradients with a red tendency represent the mRNA expression levels of DEGs and their cor responding ATAC-seq, Foxa1 and H3K27ac ChIP-seq signals with higher Z scores, whereas gradients with a blue tendency represent those with lower Z scores. (For interpretation of the references to color in this figure legend, the reader is referred to the Web version of this article.)(图注取自PDF文本层,来源:Cancer Letters, 2026)
第四步:3D基因组“折叠”拉近增强子与启动子,构建“超级增强子”
那么问题又来了:Foxa1和H3K27ac富集的这些远距离增强子,是如何影响到目标基因的?答案是:三维空间的物理拉近。
通过Hi-C实验,他们发现耐药细胞中,Rrm1和Cdadc1基因座周围的染色质环(Chromatin Loops)显著增强。ChIP-seq显示,介导环形成的绝缘子蛋白CTCF和黏连蛋白复合物(Cohesin)亚基Smc3,在Foxa1富集的区域结合也显著增加。
他们定义了一个“multi-GAIN”区域——即Foxa1、H3K27ac、CTCF、Smc3信号和染色质开放性同时增强的区域。超过80个上调基因“紧挨”着这些区域。这些增强子通过Foxa1和CTCF/Cohesin介导的环,被拉到基因启动子附近,形成一个高效的转录“反应堆”。
在此基础上,他们用H3K27ac ChIP-seq数据定义了超级增强子(SE)。耐药细胞获得了89个新的SE(GAIN SE),而Foxa1信号在这些GAIN SE上极度富集。这说明了什么?说明Foxa1不仅仅是一个“开锁匠”,它还亲自参与了“超级增强子”这个战略指挥部的搭建和运作。
@方法论点评:Hi-C、ChIP-seq和RNA-seq的多层数据叠加,让研究者能够在从线性序列到三维空间的多维度上“可视化”调控过程,这是单组学技术无法达到的深度。
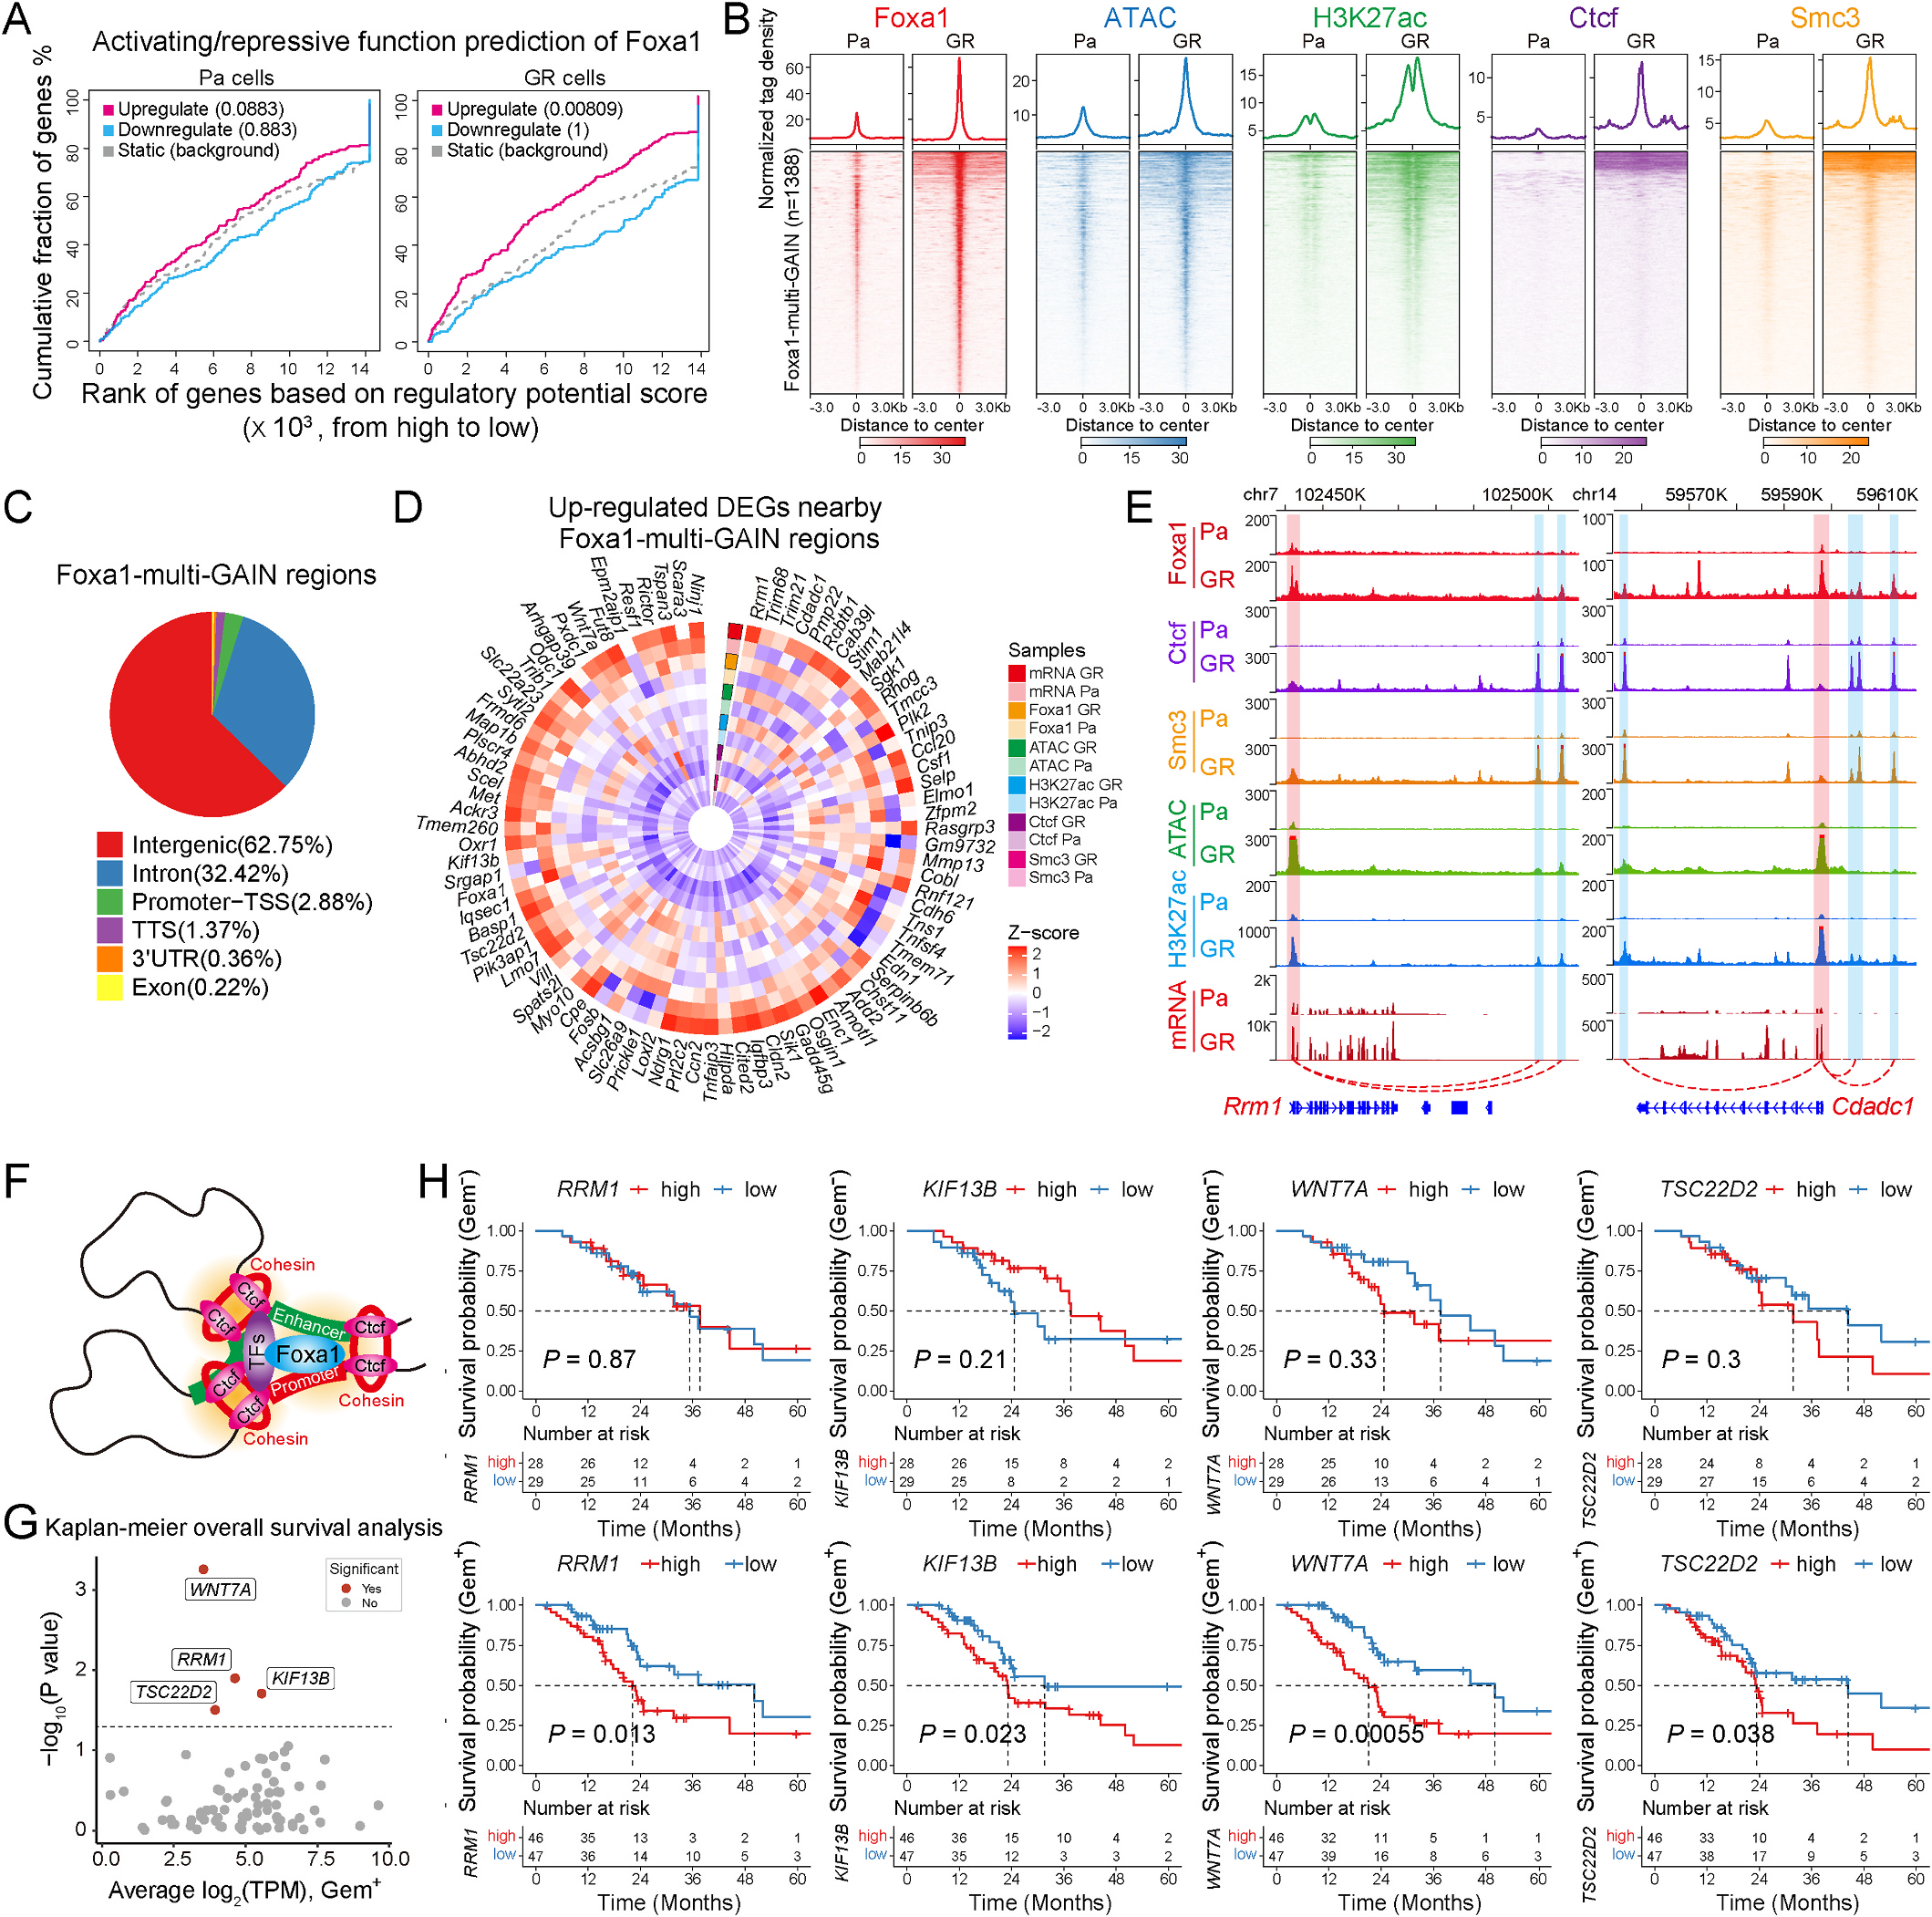
Fig. 4. Foxa1 potentiates enhancer‒promoter loops to regulate gene expression associated with gemcitabine resistance and poor clinical outcomes. (A) BETA plot of combined computational analysis of Foxa1 ChIP-seq and RNA-seq data. The gray line represents the static background, the red line represents the activating function, and the blue line represents the repressive function. (B) Distribution of the multi-GAIN regions (n = 1388) on the basis of ChIP-seq data across chromosomes in GR cells compared with those in Pa cells. (C) Pie chart illustrating the distribution of the multi-GAIN regions across various functional genomic regions. (D) Circle heatmap representing the upregulated DEGs near the multi-GAIN regions. The gene expression level (FPKM) and the corresponding signal of multi-omics data (RPKM) ranging from 1 kb up-to 1 kb downstream of the region centers are shown. (E) Genome browser snapshot of the genomic regions surrounding the Rrm1 and Cdadc1 genes. The red and blue shaded areas indicate the multi-GAIN regions located in the promoter-TSS and intergenic regions, respectively. (F) Schematic representation of the potential model illustrating Foxa1-mediated transcriptional activation via chromatin looping and enhancers. The interaction between the cohesin complex (with Smc3 as a core subunit) and CTCF facilitates the formation of chromatin loops. Foxa1, in conjunction with other TFs, specifically binds to sequences within cis-regulatory gene promoters and enhancer elements located in multiple GAIN regions of open chromatin (represented by the orange gradient area), thereby promoting transcription. (G) Scatter plot of log2 average transformed TPM (transcripts per million) and the log-rank test P value for the identified DEGs in (D). Kaplan-Meier overall survival analysis was performed for patients treated with gemcitabine in the TCGA-PAAD cohort. A P value less than 0.05 was considered statistically significant. The labelled DEGs (red dots) were associated with poor prognosis (P < 0.05). (H) Kaplan‒Meier survival curves for WNT7A, RRM1, KIF13B, and TSC22D2 in PAAD patients with (bottom panel, Gem+) or without (top panel, Gem−) gemcitabine treatment. Patients were divided into low- expression and high-expression groups according to the median ranking of gene expression levels (TPM). Studies with a follow-up duration of more than 5 years were censored for survival analyses. Statistical analysis was performed via the log-rank test, and P < 0.05 was considered statistically significant. (For interpretation of the references to color in this figure legend, the reader is referred to the Web version of this article.)(图注取自PDF文本层,来源:Cancer Letters, 2026)
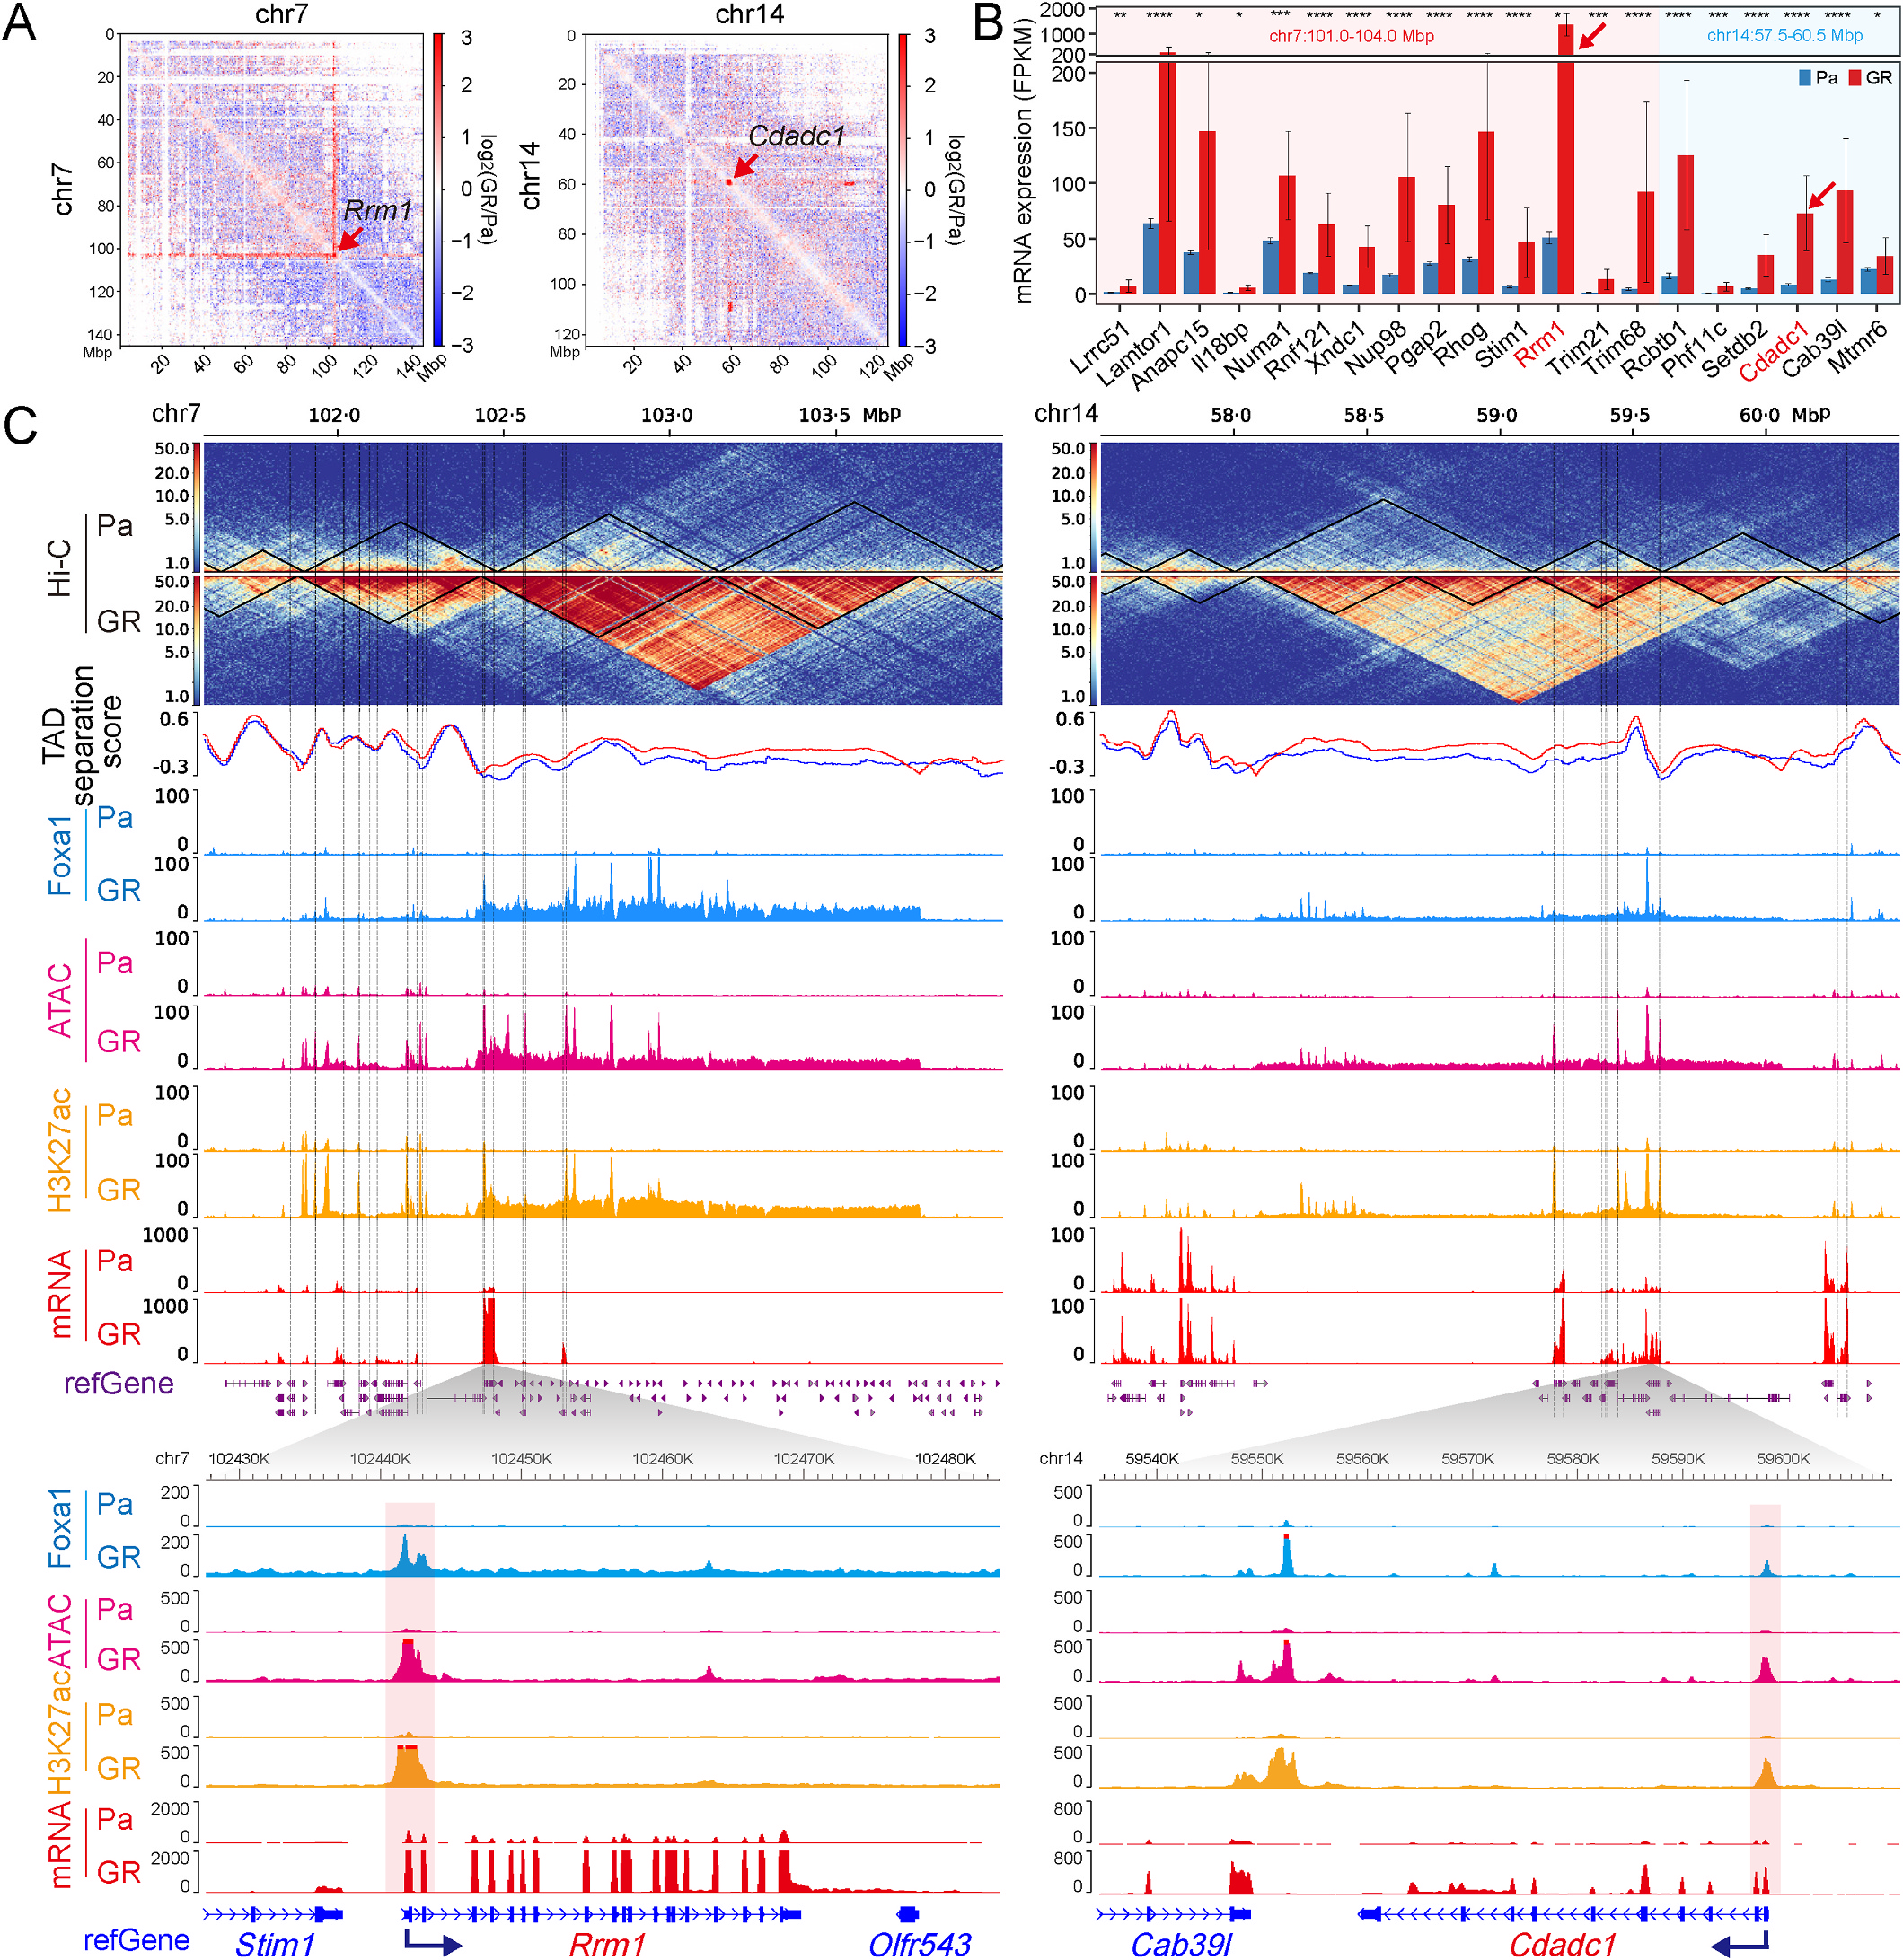
Fig. 6. 3D chromatin remodelling potentiates genomic interactions surrounding gemcitabine resistance-associated Rrm1 and Cdadc1. (A) Heatmap showing the log2 ratio comparisons of Hi-C interaction frequencies at 200 kb resolution for GR versus Pa cells. The red arrows indicate the loci of Rrm1 and Cdadc1 on chr7 (left panel) and chr14 (right panel), respectively. (B) Bar plot indicating average expression levels (FPKM) of DEGs located within chr7: 101–104 Mb (red shaded area) and chr14: 57.5–60.5 Mb (blue shaded area) adjacent to the Rrm1 (red color) and Cdadc1 (red color) genes, respectively. The FPKM and P values were calculated via Cuffdiff (v2.2.1). P < 0.05, P < 0.01, P < 0.001, P < 0.0001. (C) Genome browser views of the multi-omics data for the genomic region surrounding the Rrm1 (left panel) and Cdadc1 (right panel) genes. The heatmap (top panel) shows the Hi-C interaction frequency at 5 kb resolution, and black lines within the heatmap indicate the positions of identified topologically associated domains (TADs). The solid blue and red lines below the Hi-C matrices represent the TAD separation scores of the Pa and GR cells, respectively. The following tracks show normalized read coverage for Foxa1 (blue) and H3K27ac (orange) ChIP-seq, ATAC- seq (deep pink), and mRNA-seq (red). The black vertical dashed lines indicate the TSSs or TESs of the DEGs. The red shaded areas indicate the signal of the multi- omics data surrounding the location of the TSS. The dark blue arrow next to the gene name indicates the direction of transcription. (For interpretation of the references to color in this figure legend, the reader is referred to the Web version of this article.)(图注取自PDF文本层,来源:Cancer Letters, 2026)
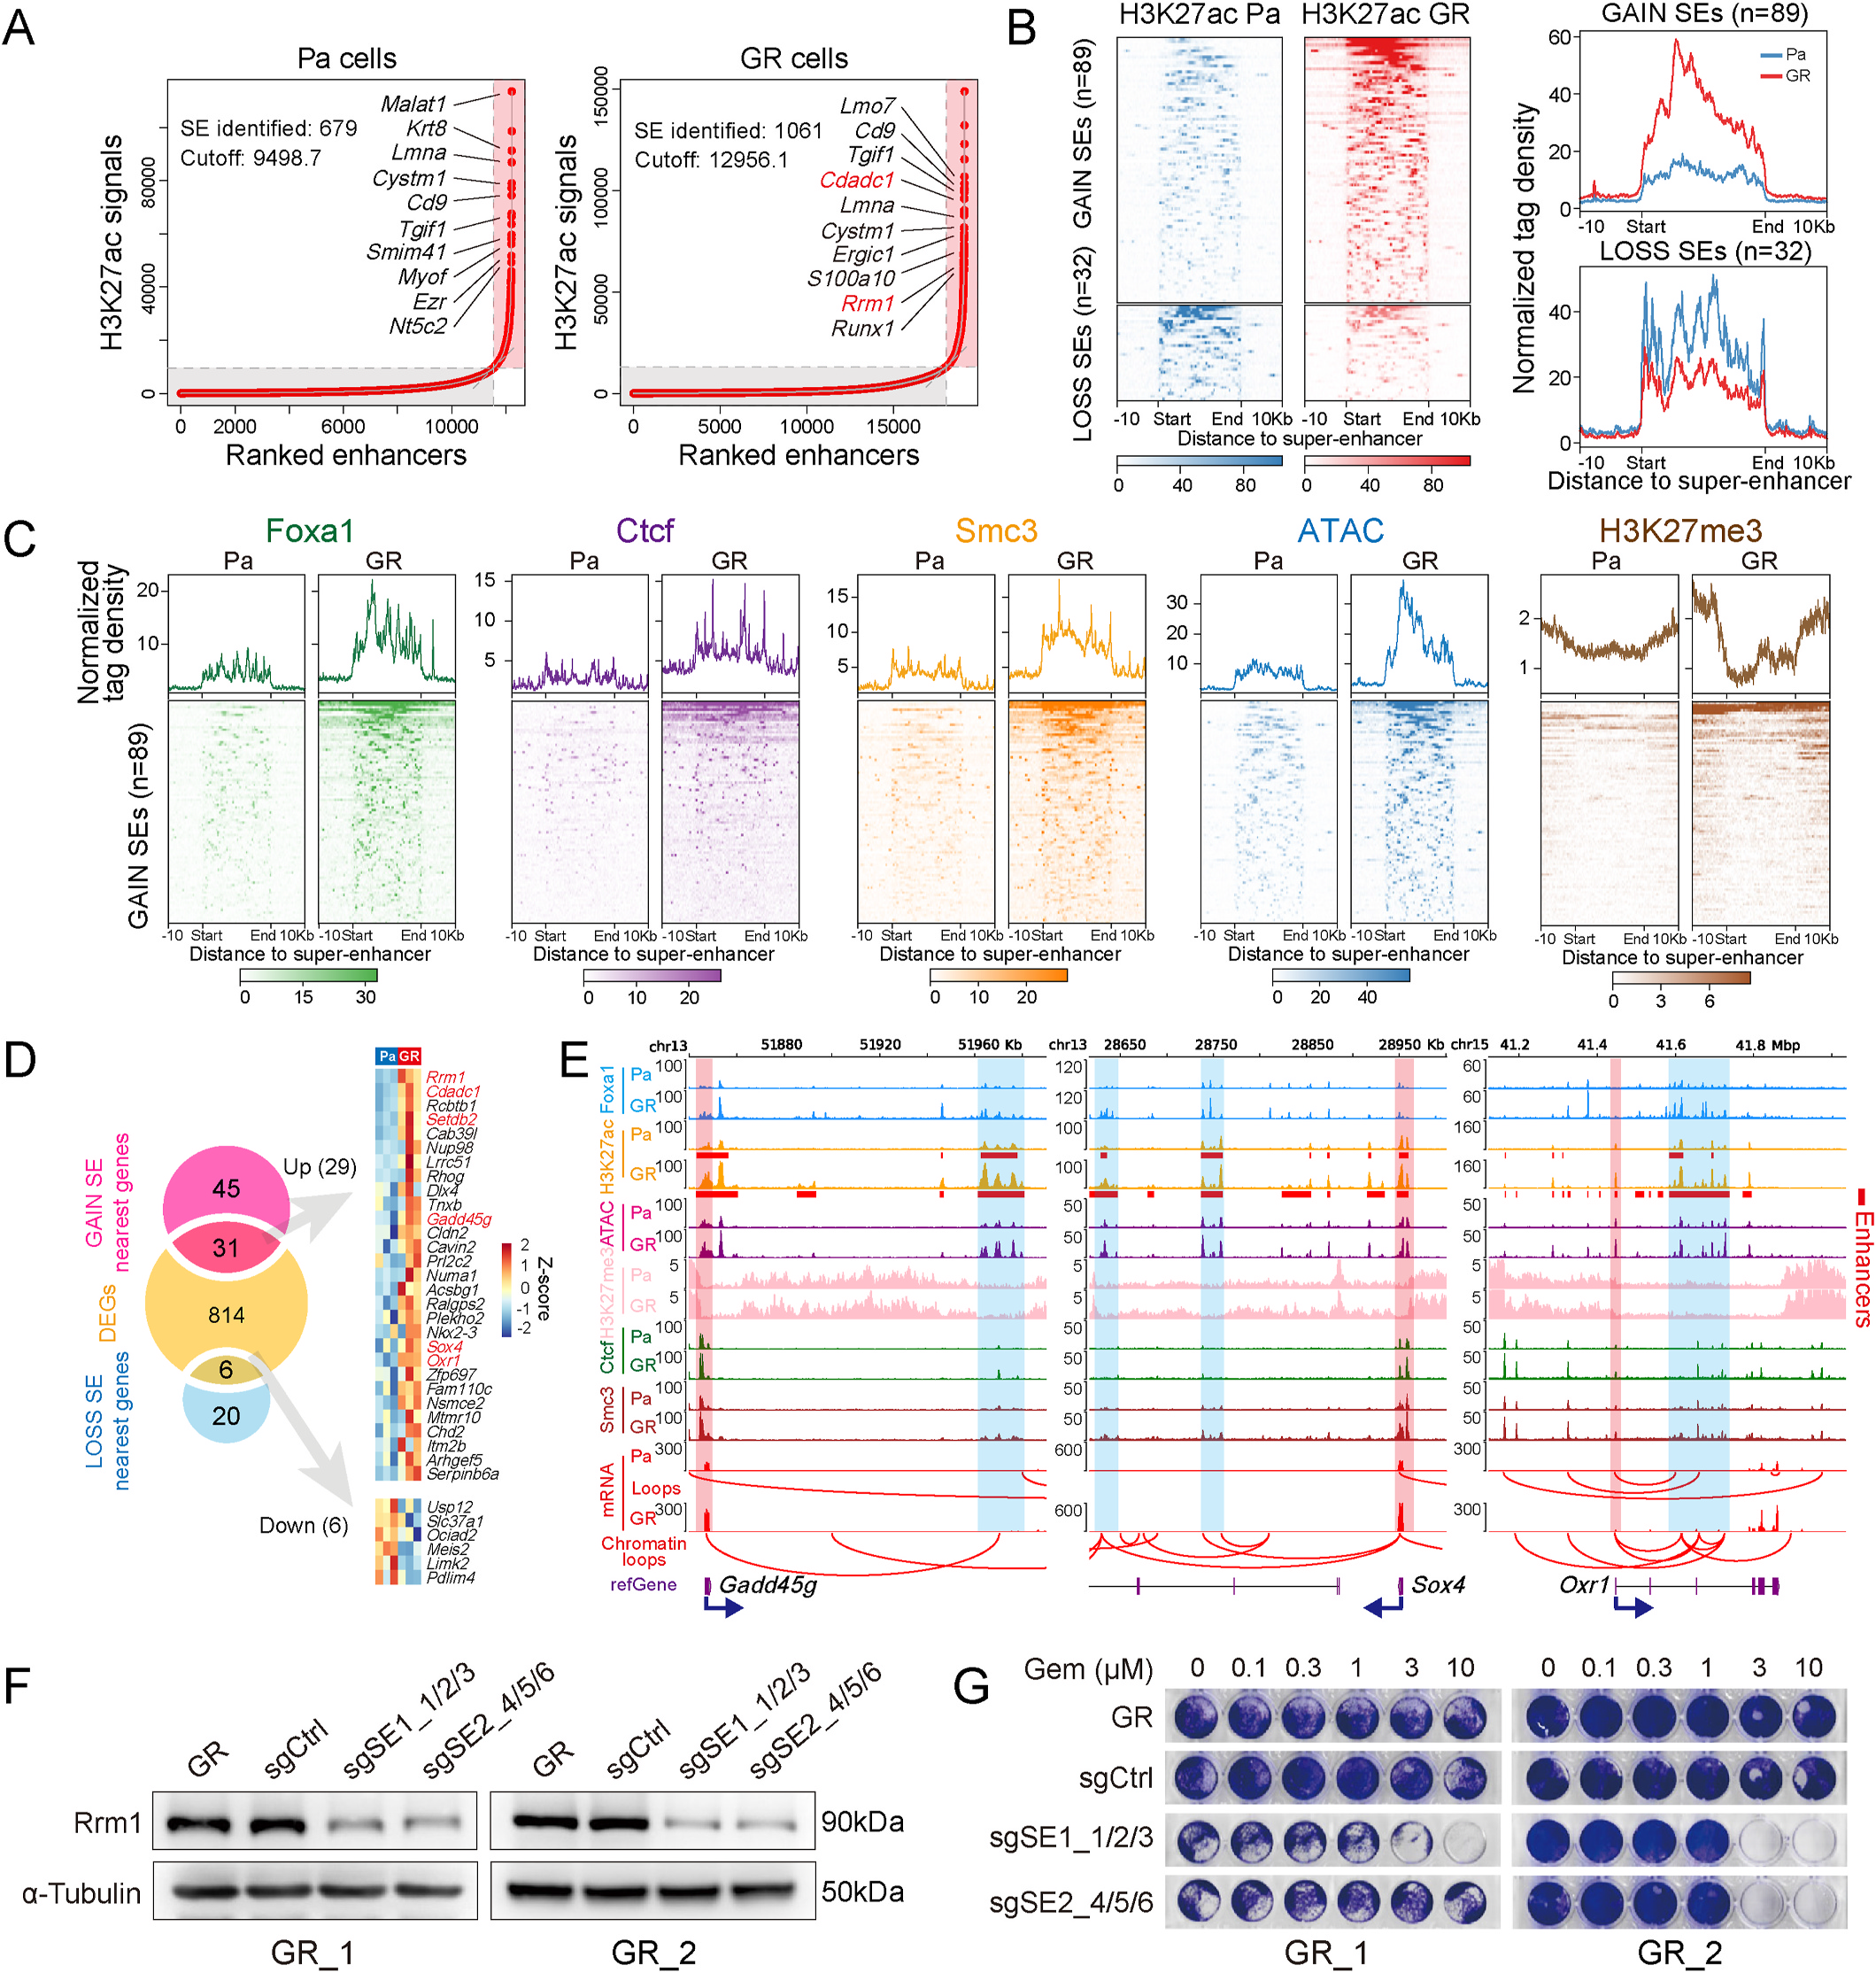
Fig. 7. SE reprogramming accounts for the differential expression of genes associated with resistance to gemcitabine. (A) Ranking plot of enhancers identified in Pa and GR cells, ranked by increasing H3K27ac signals. SEs (red shaded areas) are defined as enhancer clusters, excluding signals at the promoter, which are ranked above the inflection point of the curve. Enhancer regions below the inflection point were designated typical enhancers (TEs, gray shaded area). (B) Heatmap (left panel) and profile plots (right panel) depicting H3K27ac signals across the GAIN (n = 89) and LOSS (n = 32) SEs. Regions are displayed from 10 Kb upstream of the start to 10 Kb downstream of the end. (C) Heatmap (top panel) and average profile (bottom panel) plots represent the normalized ATAC-seq signal and ChIP-seq signal of Foxa1, Ctcf, Smc3, and H3K27me3 mapped to the upstream and downstream 10 kb at the start and end positions of each GAIN SE. (D) Venn diagram (left panel) and heatmap (right panel) showing overlapping DEGs and nearest genes of GAIN and LOSS SEs. (E) Representative upregulated DEGs (D) associated with GAIN SEs. The genomic signal tracks were extracted and visualized via the WashU Epigenome browser and displayed normalized Foxa1, H3K27ac, H3K27me3, Ctcf, Smc3, ATAC-seq, and mRNA sequencing signals. The red horizontal bars below the H3K27ac ChIP-seq tracks denote typical or SE regions. The dark blue arrow next to the gene name indicates the direction of transcription. The red arcs below the mRNA-seq tracks indicate chromatin loops between the distal enhancer (blue shaded area) and proximal promoter (red shaded area) regions, which were identified via ChIP-seq and high-resolution Hi-C data. (F) Western blot analysis of Rrm1 and α-tubulin (loading control) in resistant wild-type cells, non-targeting sgRNA control cells (sgCtrl), and cells with CRISPR/Cas9-mediated knockout of super-enhancers SE1 (sgSE1_1/2/3) or SE2 (sgSE2_4/5/6). (G) The effect of SE knockout on the proliferation of resistant cells (GR_1 and GR_2) across increasing gemcitabine concentrations (0-10 μM). (For interpretation of the references to color in this figure legend, the reader is referred to the Web version of this article.)(图注取自PDF文本层,来源:Cancer Letters, 2026)
第五步:因果验证与临床转化,BET抑制剂拆解“指挥部”
找到了“指挥部”(Foxa1-SE轴),就必须证明它确实是导致耐药的原因,而非结果。
他们进行了严格的因果验证:
敲除Foxa1:耐药细胞对吉西他滨敏感性恢复,Rrm1和Cdadc1表达下降。 敲除Rrm1/Cdadc1:能模拟Foxa1敲除的致敏效应。 回补实验:在敲除Foxa1的细胞中再过量表达Rrm1或Cdadc1,可以部分“挽救”耐药性。 CRISPR/Cas9敲除SE:直接敲除Rrm1附近的SE区域,同样能逆转耐药。
这一连串实验构成了强有力的证据链。更妙的是,他们还发现Foxa1蛋白的稳定依赖于USP7介导的去泛素化,这又为干预提供了另一个潜在靶点。
最后,他们将靶向SE的BET抑制剂AZD5153引入战场。在体内实验中,AZD5153联合吉西他滨,能显著抑制耐药肿瘤的生长,甚至诱导肿瘤消退。在机制上,联合治疗“拆除”了Foxa1-SE驱动的转录程序。
@方法论点评:全文从“描述”到“机制”再到“干预”,逻辑链完整。通过“敲除-回补-药物抑制”的多层次验证,确保了结论的稳健性。临床前PDX模型和临床样本分析(TCGA和瑞金医院队列)进一步提升了研究的临床转化价值。
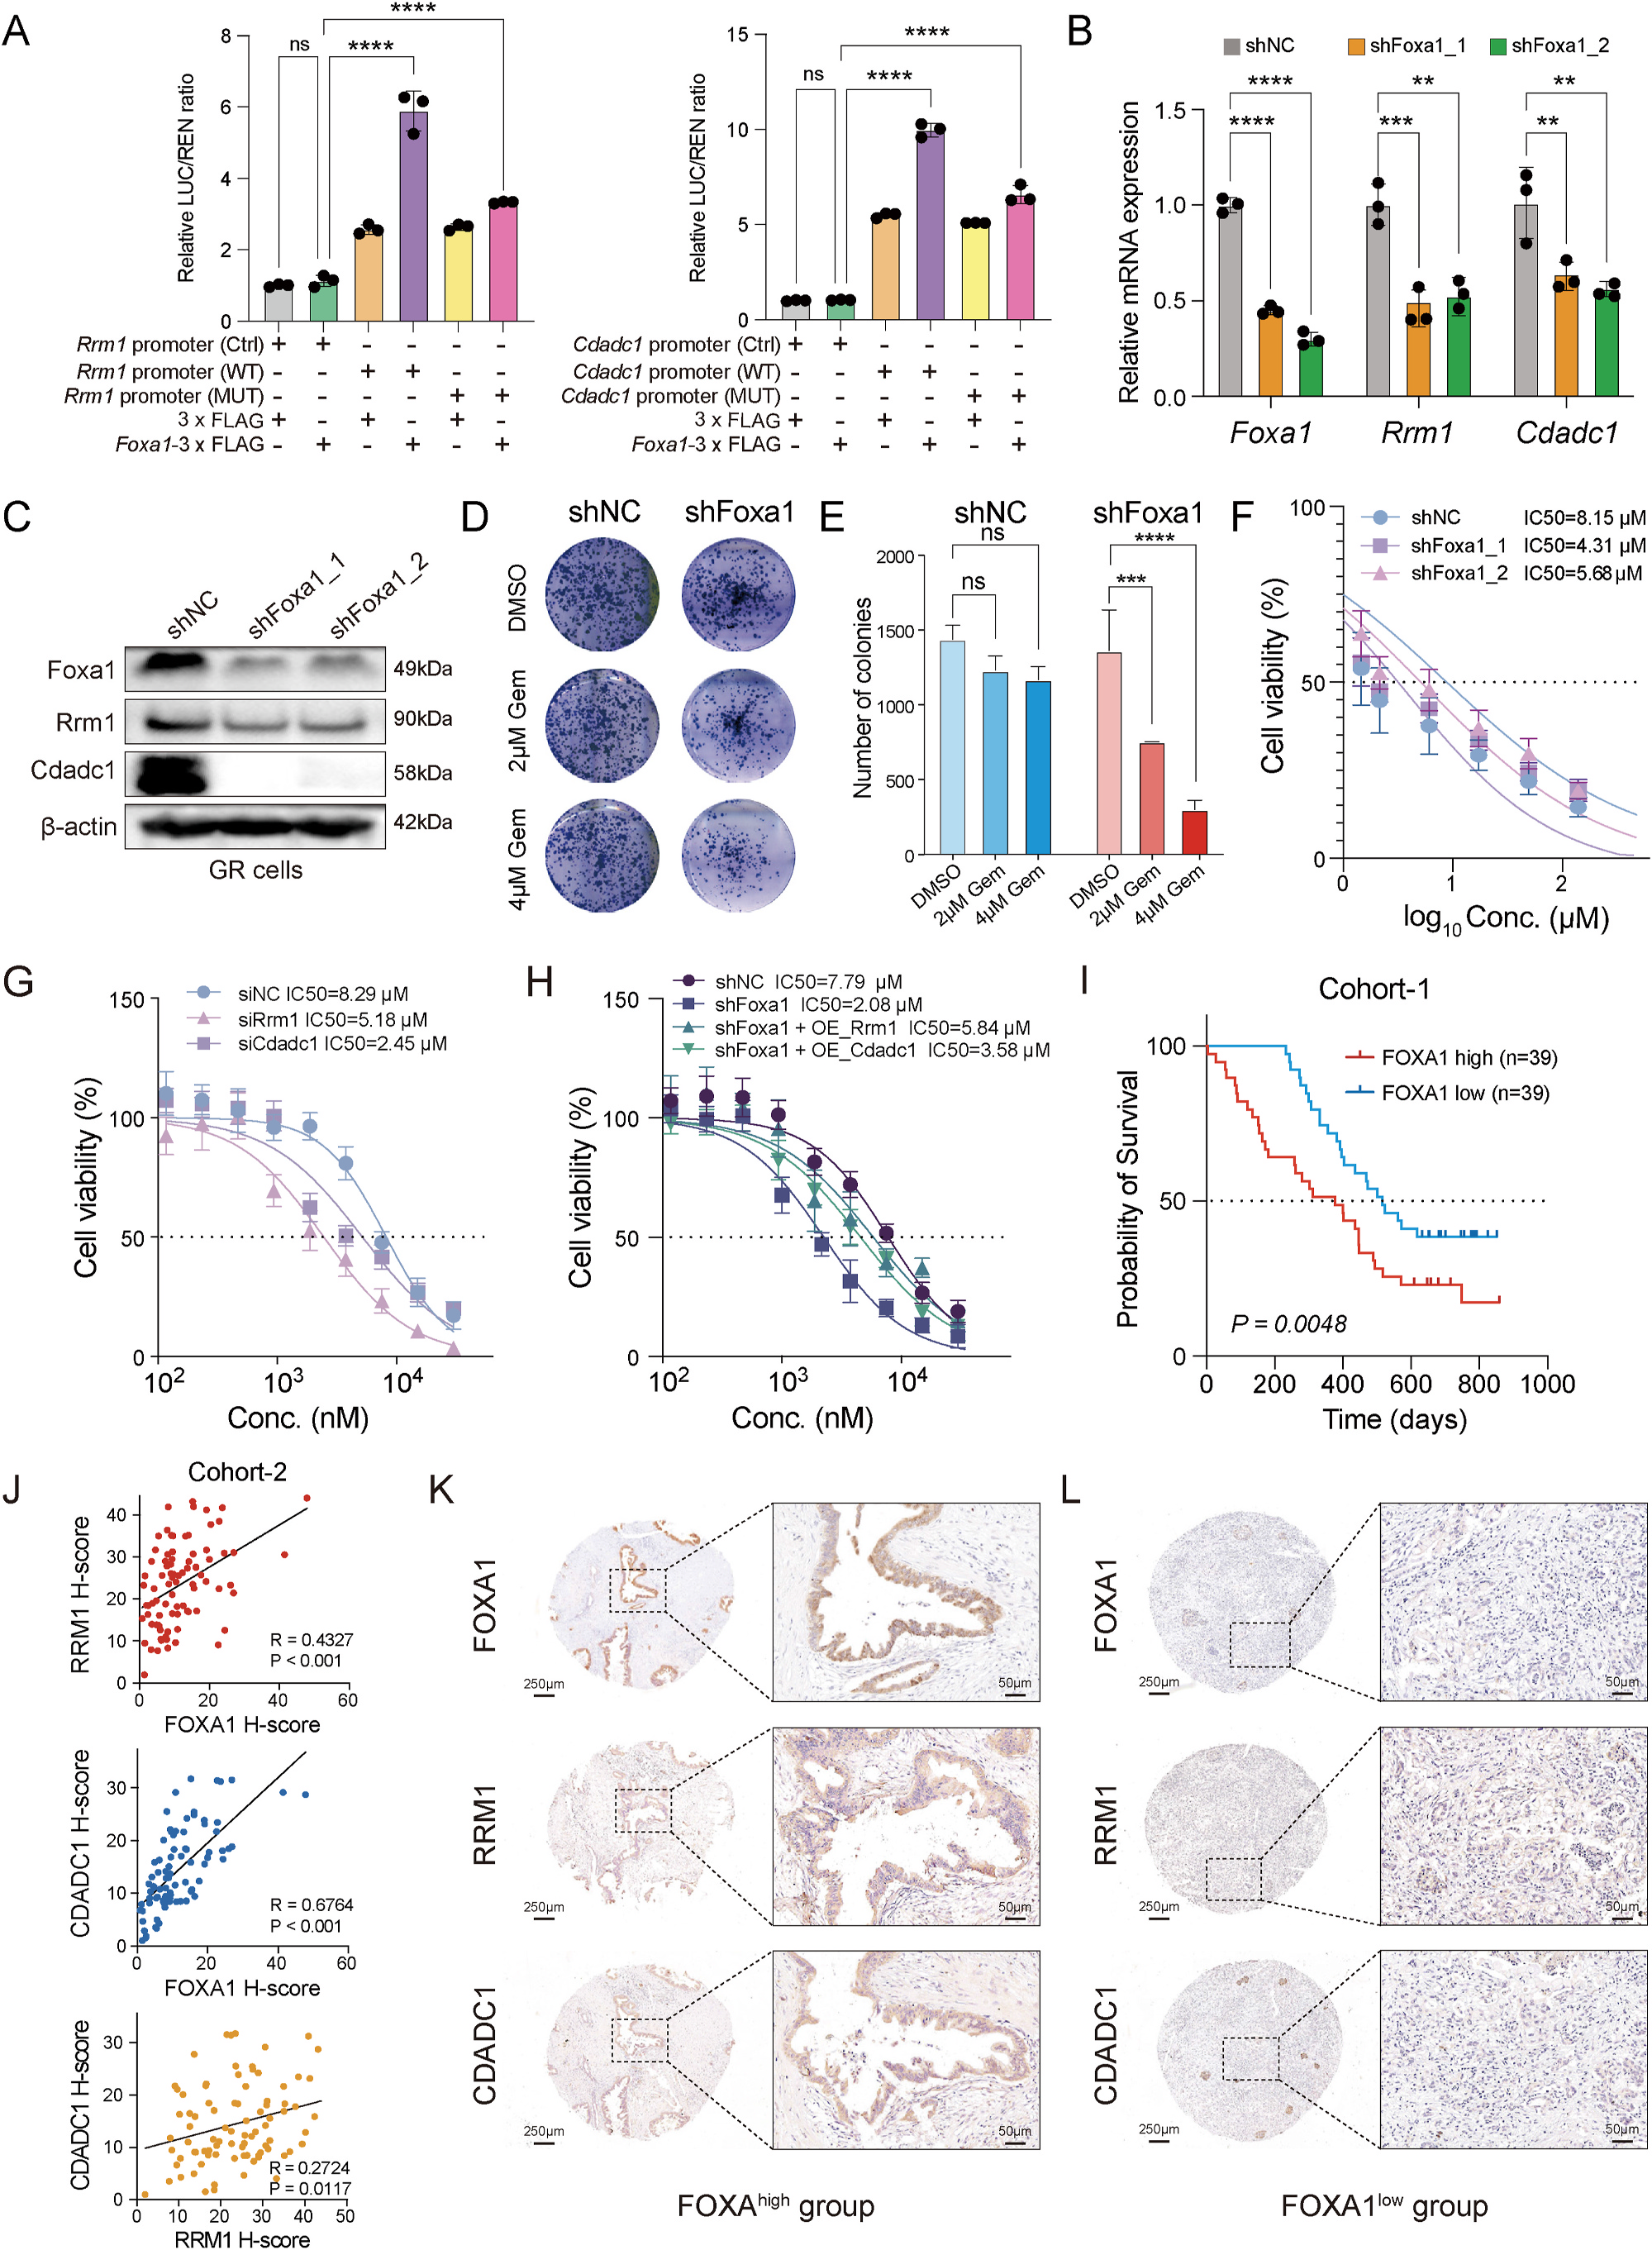
Fig. 5. Suppression of Foxa1 led to reduced cell viability and increased sensitivity to gemcitabine via downregulation of Rrm1 and Cdadc1. (A) Dual luciferase assay showing Rrm1 (left panel) and Cdadc1 (right panel) promoter activity expressed as a ratio of luciferase (LUC) to Renilla (REN), where an increase in activity equates to an increase in LUC relative to REN. Asterisks indicate significant differences determined by Student’s t-test at P < 0.0001. (B and C) qPCR (B) and western blots (C) showing the mRNA and protein levels of Rrm1 and Cdadc1 in GR cells following Foxa1 knockdown via shRNA transfection. (D and E) Representative images (D) and quantification (E) of colony formation in GR cells. (F) The impact of Foxa1 knockdown on gemcitabine sensitivity in GR cells was measured via the sulfo rhodamine B (SRB) assay. (G) Dose-response curves of GR cell viability (%) treated with increasing concentrations of gemcitabine following transfection with negative control siRNA (siNC) or siRNAs targeting Rrm1 (siRrm1) or Cdadc1 (siCdadc1). IC50 values indicate increased chemosensitivity upon Rrm1 or Cdadc1 knockdown. (H) Rescue experiments in Foxa1-depleted (shFoxa1) GR cells overexpressing Rrm1 (OE_Rrm1) or Cdadc1 (OE_Cdadc1). Dose-response curves demonstrate partial restoration of gemcitabine resistance, with IC50 values highlighting the roles of Rrm1 and Cdadc1 in Foxa1-mediated drug response. (I) Kaplan- Meier analysis of overall survival in a pancreatic cancer cohort (Ruijin hospital, China) stratified by FOXA1 expression (high vs. low, n = 39 each). High FOXA1 correlates with poorer prognosis (log-rank test, P = 0.0048). (J) Scatter plots showing significant positive correlations among FOXA1, RRM1, and CDADC1 protein levels (H-scores) in human PDAC cohort (Ruijin hospital, China). Pearson correlation coefficients (R) and P values are indicated. (K and L) Representative IHC images of FOXA1, RRM1, and CDADC1 expression in FOXA1-high (Patient 1, K) and FOXA1-low (Patient 2, L) pancreatic tumors, confirming co-expression patterns.(图注取自PDF文本层,来源:Cancer Letters, 2026)
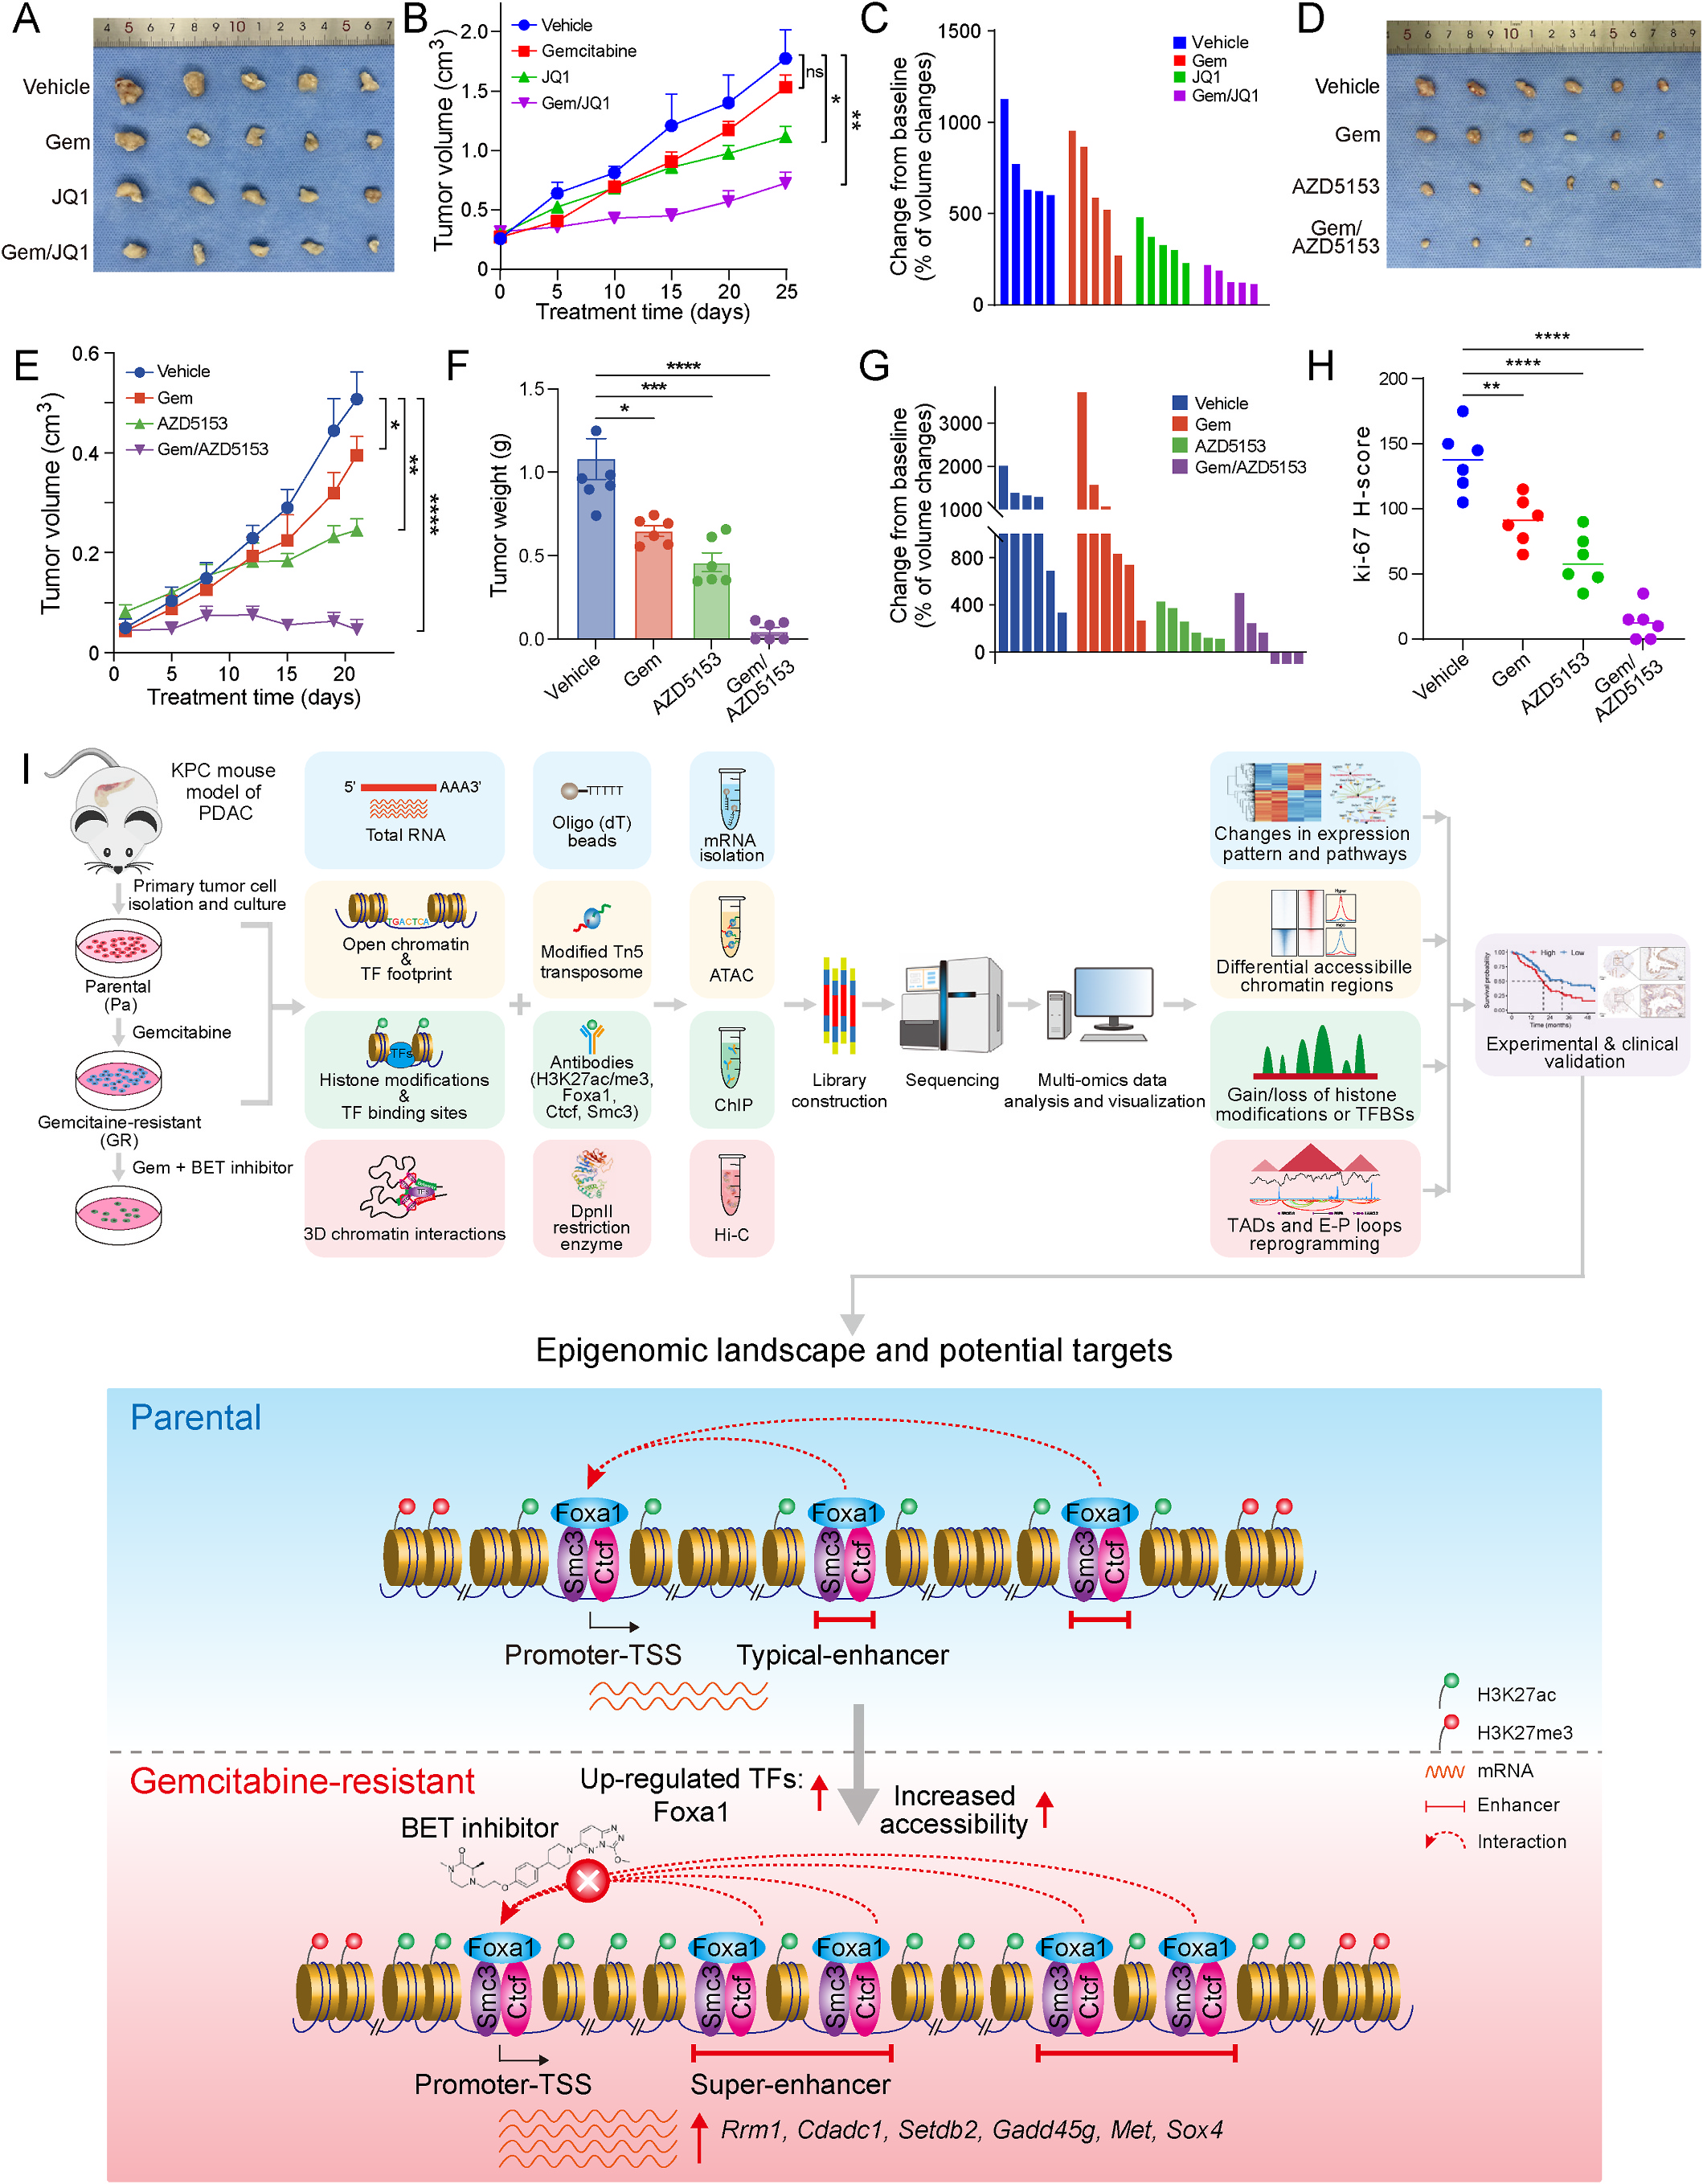
Fig. 8. BET inhibition sensitizes pancreatic cancer to gemcitabine. (A) Representative images of gemcitabine-resistant cell-derived xenograft (CDX) subcu taneous tumors after the indicated treatments with gemcitabine, JQ1 or their combination. Statistical significance was calculated via one-way ANOVA (ns, P > 0.05; , P < 0.05; , P < 0.01). (B) Tumor volume measurements from CDX models treated as in A. Statistical significance was determined by one-way ANOVA: ns, P > 0.05; , P < 0.05; , P < 0.01. (C) Waterfall plots showing individual tumor volume dynamics (n = 5 tumors per group) in xenograft models treated as in A, demonstrating reversal of resistance with combinatorial therapy. (D) Representative images of gemcitabine-resistant CDX tumors from mice treated with vehicle, gemcitabine (100 mg/kg), AZD5153 (BET inhibitor, 50 mg/kg), or combination therapy (gemcitabine/AZD5153). (E and F) Tumor volume (E) and weight (F) measurements from CDX models treated as in D. Statistical significance was determined by one-way ANOVA: , P < 0.05; , P < 0.001; , P < 0.0001. (G) Waterfall plots showing individual tumor volume dynamics (n = 6 tumors per group) in xenograft models treated as in D, demonstrating reversal of resistance with combinatorial therapy. (H) The Ki-67 H-scores (histochemistry score) in xenograft tumor tissues treated with Vehicle, gemcitabine, AZD5153, or the combination Gem/AZD5153. Data are presented as mean ± SEM. Statistical significance was determined by one-way ANOVA: , P < 0.01; , P < 0.0001. (I) Schematic illustration of workflow and epigenomic reprogramming in gemcitabine-resistant pancreatic cancer cells: Primary tumor cells derived from three KPC mouse models of PDAC were treated with gemcitabine to establish resistant cell lines. Subsequently, comprehensive libraries of RNA-seq, ATAC-seq, ChIP-seq, and Hi-C data were systematically constructed to determine differential gene expression, chromatin accessibility, TF binding, histone modification, and 3D genomic interactions at different stages of the study; integrated analyses coupled with experimental and clinical validation were then employed to elucidate the epigenomic mechanisms and potential therapeutic targets associated with gemcitabine resistance. Here we proposed that the enhanced binding affinity of Foxa1 enables its recognition and association with nascently formed SE regions, characterized by elevated H3K27ac and a concurrent reduction in H3K27me3. These alterations potentiate increased chromatin accessibility, thereby facilitating the recruitment of additional TFs and coregulatory complexes, notably Ctcf/Smc3 (cohesion), which are instrumental in orchestrating long-range promoter‒enhancer interactions. Consequently, this cascade promotes the augmented expression of a subset of resistance-associated genes, particularly Rrm1, Cdadc1, Met, and Oxr1, culminating in gemcitabine-resistant cells. Suppression of Foxa1 activity or pharmacological disruption of SEs via BET inhibitors such as AZD5153 or JQ1 can effectively reverse this resistance phenotype, restoring sensitivity to gemcitabine and ultimately inducing apoptosis in previously resistant PDAC cells.(图注取自PDF文本层,来源:Cancer Letters, 2026)
核心结论
本文提出了一个全新的耐药模型:在吉西他滨压力下,胰腺癌细胞通过USP7稳定并上调先锋转录因子Foxa1。Foxa1与CTCF/Cohesin协同,在三维基因组上重新布线,建立新的超级增强子,从而“强制”高表达Rrm1、Cdadc1等核心耐药基因。这一表观基因组层面的“硬连线”是耐药细胞获得顽强生存能力的关键。而使用BET抑制剂AZD5153破坏该超级增强子结构,能有效逆转耐药,为临床治疗提供了全新策略。
对耐药/DTP/PGCC 的启示
“获得性”表观遗传重编程是耐药的核心驱动:本研究清晰展示了耐药不仅仅是基因突变筛选的结果,更是细胞主动建立的一个由先锋因子驱动的、稳定的表观遗传“新常态”。这提示我们在研究药物耐受持久细胞(DTP)时,应更多关注染色质可及性和增强子重塑这些“上层建筑”的改变,而非仅仅盯着基因突变。 聚焦“种子”转录因子:Foxa1这类先锋因子是启动整个耐药程序的“点火器”。将研究方向从“耐药通路”上移至“调控通路的转录因子”,可能找到更上游、更普适的干预靶点。这与DTP细胞依赖特定谱系转录因子存活的现象高度吻合。 临床可干预的“表观基因组脆弱性”:超级增强子驱动的基因转录对BET抑制剂高度敏感,这为清除DTP细胞或克服PGCC介导的耐药提供了明确的表观遗传药物策略。AZD5153的成功应用提示,针对Foxa1/BRD4/SE轴可能是临床上破解胰腺癌耐药的可行路径。
局限
文中提及部分局限:研究主要基于KPC小鼠来源的细胞系,虽有利于机制剖析,但可能无法完全模拟人源肿瘤的异质性。此外,该研究使用的是广谱BET抑制剂,BRD2/3/4各自在Foxa1介导的耐药逆转中的具体贡献尚待进一步拆解。
来源
期刊:Cancer Letters,2026。DOI: 10.1016/j.canlet.2026.218721