一句话亮点
降糖药卡格列净(Canagliflozin)不仅能结合AR配体结合域(LBD)阻断信号,还能通过下调HSP70、促进泛素化,降解全长AR和截短变异体AR-V7——后者正是导致临床ARPI耐药的头号罪犯。
背景/痛点
目前前列腺癌治疗的大逻辑是雄激素剥夺(ADT)+二代AR通路抑制剂(ARPIs,如恩杂鲁胺、阿帕他胺)。这套组合拳确实延长了生存期,但两个现实问题始终摆在那:一是药物副作用大(骨质疏松、心血管事件、性欲丧失),二是迟早耐药,尤其AR-V7阳性的患者,恩杂鲁胺基本等于白用。
AR-V7这种截短变异体缺了配体结合域(LBD),所以靶向LBD的传统ARPI根本拿它没办法。过去十来年大家都在找能同时降解AR-FL和AR-Vs的分子,PROTAC这类策略很热闹,但至今没有一个走到临床。那作者就琢磨了:与其从头设计一个新分子,不如看看已有药物里有没有能"兼职"干这活的?
他们之前已经发现卡格列净能抑制前列腺癌生长、改变基因表达谱,而且被调得最明显的恰恰是AR信号通路的基因。所以这篇文章的核心假说就这么来了:卡格列净可能是一个被忽略的、藏身在降糖药里的新型ARPI。
推理链分步拆解
第一步:先看效果——卡格列净能抑瘤,而且有独特优势
作者首先要确认的是,卡格列净在体外和体内的抗肿瘤效果到底怎么样,跟现有SGLT2抑制剂和二代ARPI比有没有竞争力。他们在LNCaP(CSPC)和22RV1(CRPC)两种细胞系上做了增殖和克隆形成实验。结果挺有意思的:同属SGLT2i的达格列净几乎没效果,而卡格列净的抑制能力跟阿帕他胺、达罗他胺相当,在22RV1里的IC50还优于恩杂鲁胺(恩杂鲁胺在22RV1里IC50 > 100 μM,基本等于无效)。
在22RV1荷瘤小鼠模型里,7天短期给药肿瘤体积就缩了65%,长期给药生存期延长了10天(对照组18天 vs 卡格列净组28天)。体重没掉,只是喝水多了、尿多了——这是SGLT2抑制剂在啮齿动物里的经典表现,说明给药是有效的。
@方法论点评:这里做了一个很重要的对照——达格列净无效,说明卡格列净的效果不是SGLT2抑制这个"本职功能"带来的,而是"脱靶"的。这为后续找AR这个新靶点铺了路。体内实验设计也严谨:先做短期(看分子标志物变化)再做长期(看生存获益),两套数据互相印证。
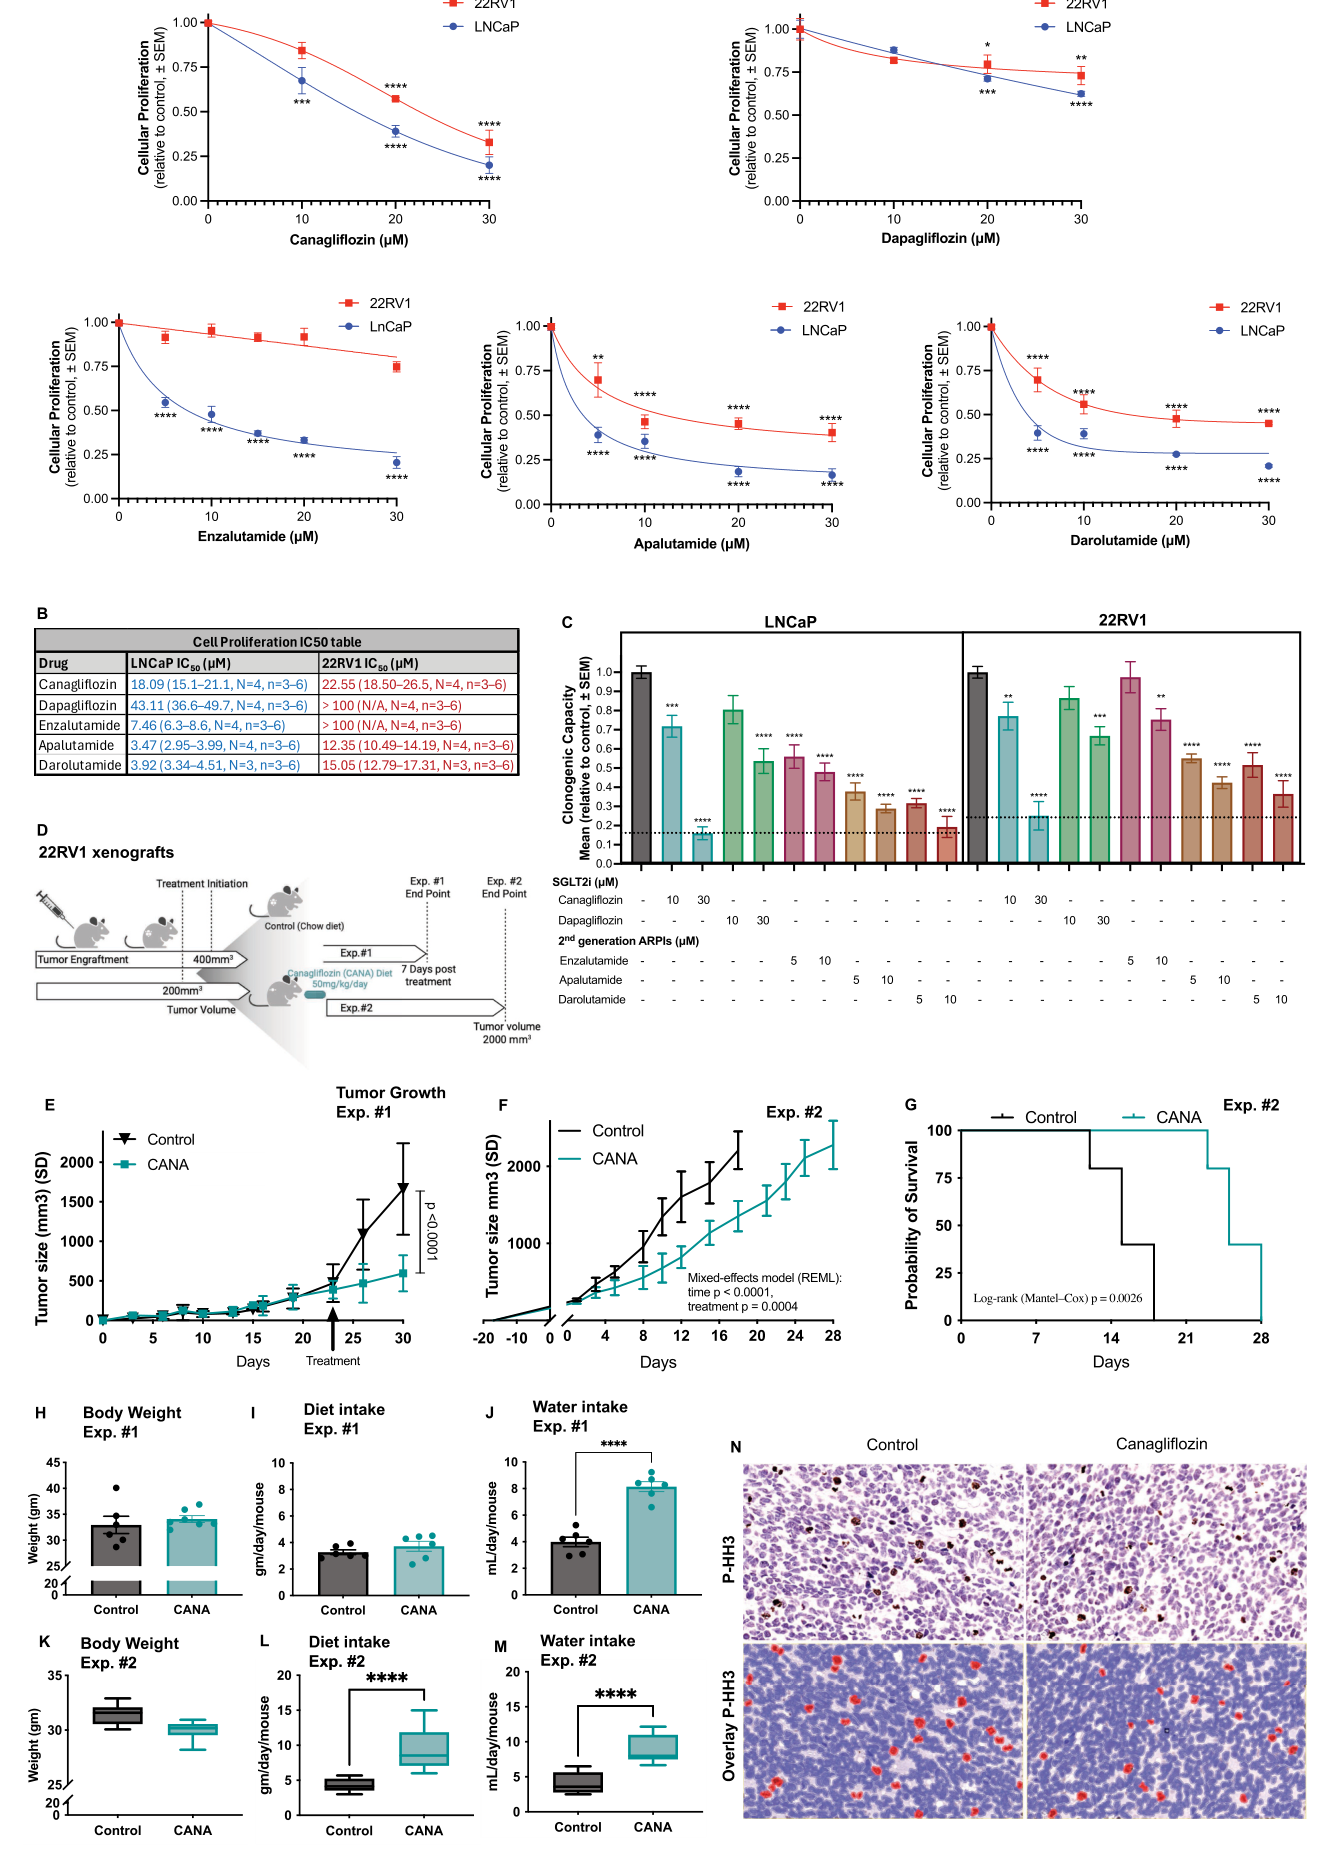
Fig. 1. Canagliflozin suppresses cell proliferation, clonogenic survival, and tumor growth in vitro and in vivo. LNCaP and 22RV1 cells were treated with clinically achievable concentrations of SGLT2is, canagliflozin and dapagliflozin (0–30 μM), or antiandrogens, enzalutamide, apalutamide, and darolutamide (0–10 μM), and (A-B) cell proliferation or (C) clonogenic survival was assessed. (D) Schematic of the in vivo treatment regimen for NRG mice bearing 22RV1 xenografts, showing short-term (Exp. #1) and long-term survival (Exp. #2) endpoints (created with BioRender.com). (E–F) In vivo tumor growth kinetics for (E) Exp. #1 (N = 6–7) and (F) Exp. #2 (N = 5). Tumor volumes are shown as mean ± SD for Exp. #1 and mean ± SD for Exp. #2. Tumor growth curves in panel E were analyzed using mixed-effects modeling with FDR correction, while panel F was analyzed using a mixed-effects model (REML) for repeated measures. (G) Kaplan–Meier analysis of time to tumor endpoint for Exp. #2. Event was defined as tumor volume ≥2000 mm3. Statistical significance was determined using the log-rank (Mantel–Cox) test. (H–J) Mouse body weight at endpoint (H), diet intake (I), and water intake (J) for Exp. #1. (K–M) Average body weight (K), diet intake (L), and water intake (M) for Exp. #2. (N) Phosphorylated histone H3 (P-HH3 (Ser10)) immunohistochemistry with digitally overlaid identification of P-HH3–positive nuclei for Exp. #1. For data analysis, cells and tumors were used with at least N ≥3 biological replicates. Statistical significance for panels H–M was determined using a two-tailed unpaired Student’s t-test, while other comparisons were analyzed using one- or two-way ANOVA with Tukey’s post-hoc multiple comparisons test. Data are presented as mean ± SEM, except for in vivo panels E–F and K–M, which are shown as mean ± SD. Statistical significance is indicated as P < 0.05, P < 0.01, P < 0.001, P < 0.0001.(图注取自PDF文本层,来源:Cancer Letters, 2026)
第二步:转录组冒烟了——AR通路被狠狠压制
那这个抑瘤效果背后的分子层面发生了什么?他们做了RNA-seq,LNCaP和22RV1两个细胞系各处理24小时。结果发现卡格列净影响了大量基因,其中有313个基因在两个细胞系里都下调,包括直接AR靶标KLK2/3(PSA)、NKX3-1,以及AR共调控因子。GSEA富集分析显示,雄激素应答、E2F靶标、细胞周期、MYC、DNA修复这些促癌通路全部被压制。
@方法论点评:RNA-seq是典型的"无偏筛查"策略——不预设具体机制,先看全局转录组变化,再从中挑线索。作者这里卡了两个细胞系(CSPC和CRPC),找到了"共同下调"的基因集,这比单细胞系的结论更有说服力,排除了一些细胞系特异性的噪音。
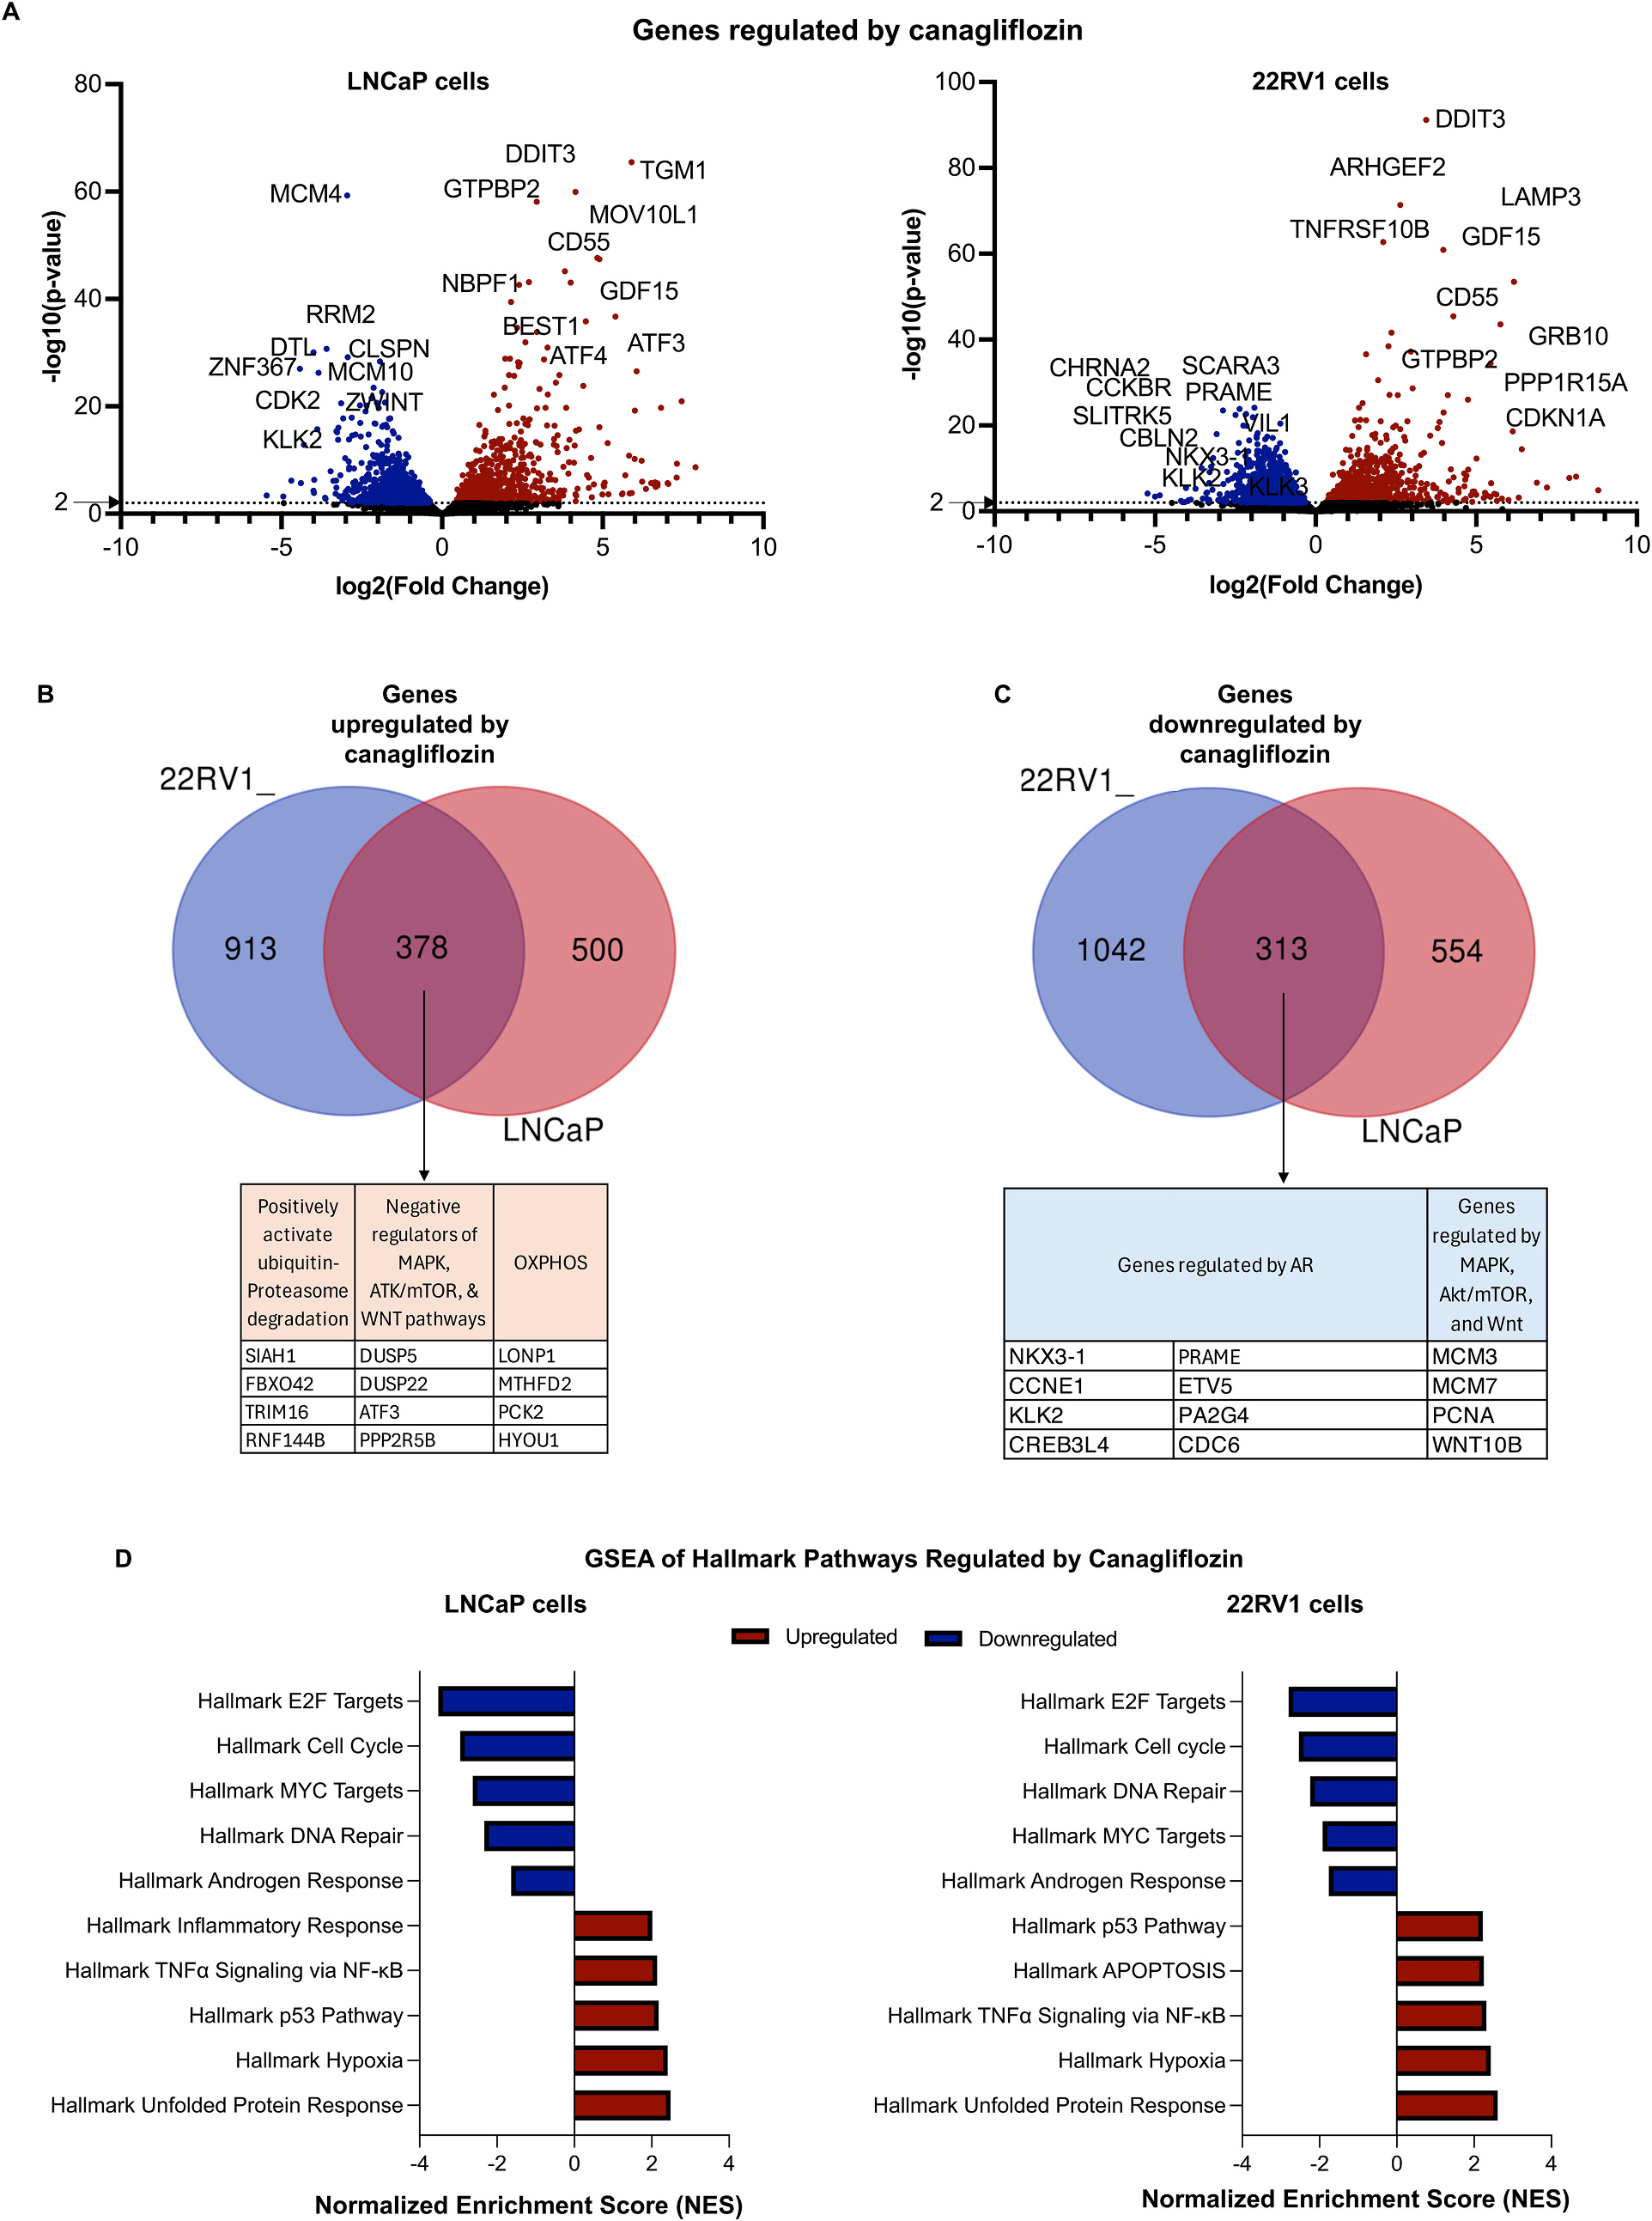
Fig. 2. Canagliflozin supresses AR-pathway and survival genes and pathways in CRPC and CSPC cells. RNA-seq was performed on LNCaP (CSPC) and 22RV1 (CRPC) cells treated with 30 μM canagliflozin or DMSO for 24 h. (A) Volcano plots demonstrating (-log10 P ≥2 (rank), FDR <0.05) significant upregulated genes (red) and downregulated (blue) genes with non-significant (rank score <2 in black dots). (B–C) Venn diagrams demonstrate significantly (B) upregulated or (C) downregulated genes. (D) Waterfall plots depict the top significantly upregulated and downregulated hallmark pathways by canagliflozin in each cell line (FDR <0.05). RNA-seq analyses were performed using three independent biological replicates (N = 3), denoted as A, B, and C for each group (Control A–C and CANA A–C). (For interpretation of the references to color in this figure legend, the reader is referred to the Web version of this article.)(图注取自PDF文本层,来源:Cancer Letters, 2026)
第三步:蛋白层面确认——AR-FL和AR-V7都被干掉了
转录组提示AR通路被压制,那问题就来了:是转录水平的变化还是蛋白水平也被影响了?他们用不同抗体(NTD抗体识别所有AR亚型、LBD抗体只识别AR-FL、CE3抗体特异性识别AR-V7)做免疫印迹。结果显示卡格列净在LNCaP里剂量依赖地降低AR-FL、PSA、NKX3-1。在22RV1里更关键——恩杂鲁胺只能降AR-FL,对AR-V7没招,而卡格列净同时把AR-FL和AR-V7都降下来了。核质分离实验进一步确认,卡格列净把细胞核里的AR也清了,这就直接剥夺了AR作为转录因子的"工作场所"。
@方法论点评:使用三种不同特异性的抗体来区分AR-FL和AR-Vs,是这篇研究在方法学上非常漂亮的一笔。很多研究会把"AR总蛋白下调"和"AR-V7下调"混为一谈,但这里用CE3抗体专门盯AR-V7,结论干净利落。

Fig. 3. Canagliflozin inhibits full-length (AR-FL) and truncated (AR-Vs) androgen receptor protein levels in CSPC and CRPC, both in vitro and in vivo. (A) Heatmaps illustrate significantly regulated genes by canagliflozin (FDR <0.05) involved in AR signaling (N = 3). (B) An illustrative graph shows the domain structure of AR isoforms and the specificity of AR (NTD), AR-V7 (CE3), and AR-FL (LBD) antibodies used in this study (created with BioRender.com). (C-D) Immunoblots and quantification of AR-FL, AR-Vs, AR-V7, NKX3-1, and PSA in (C) LNCaP (CSPC) and (D) 22RV1 (CRPC) cells, Data represented as ± SEM, N = 3. (E) Cytosolic and nuclear distribution of AR-FL, AR-Vs, and NKX3-1 in canagliflozin-treated 22Rv1 cells were analyzed. Data are represented as ± SEM; N = 3, except for NKX3-1 nuclear and cytosolic, N = 2. (D) Immuno-histochemistry (IHC) analysis for the AR-FL protein and its quantification, Data are represented as ± SEM; N = 4. Data are presented ±SEM and One-way ANOVA with Tukey’s post hoc test performed, where p < 0.05, p < 0.01, p < 0.001, p < 0.0001. N = 3 for in vitro and N = 4 for in vivo data analysis.(图注取自PDF文本层,来源:Cancer Letters, 2026)
第四步:因果验证——AR是卡格列净的关键靶点
既然相关性看到了,那因果关系得建立起来。他们在LNCaP里用siRNA敲低AR-FL,结果发现细胞对卡格列净的敏感性显著下降:在30 μM浓度下,对照组抑制率约65%,敲低组降到39%。睾酮刺激实验也佐证了这一点:睾酮能上调AR-FL和PSA,卡格列净可以把这个上调按回去。
@方法论点评:这是典型的"靶点依赖性"验证——把靶点拿掉,药物效果减弱,说明效果确实主要经由这个靶点。这种实验是区分"主效应"和"旁观者效应"的金标准。
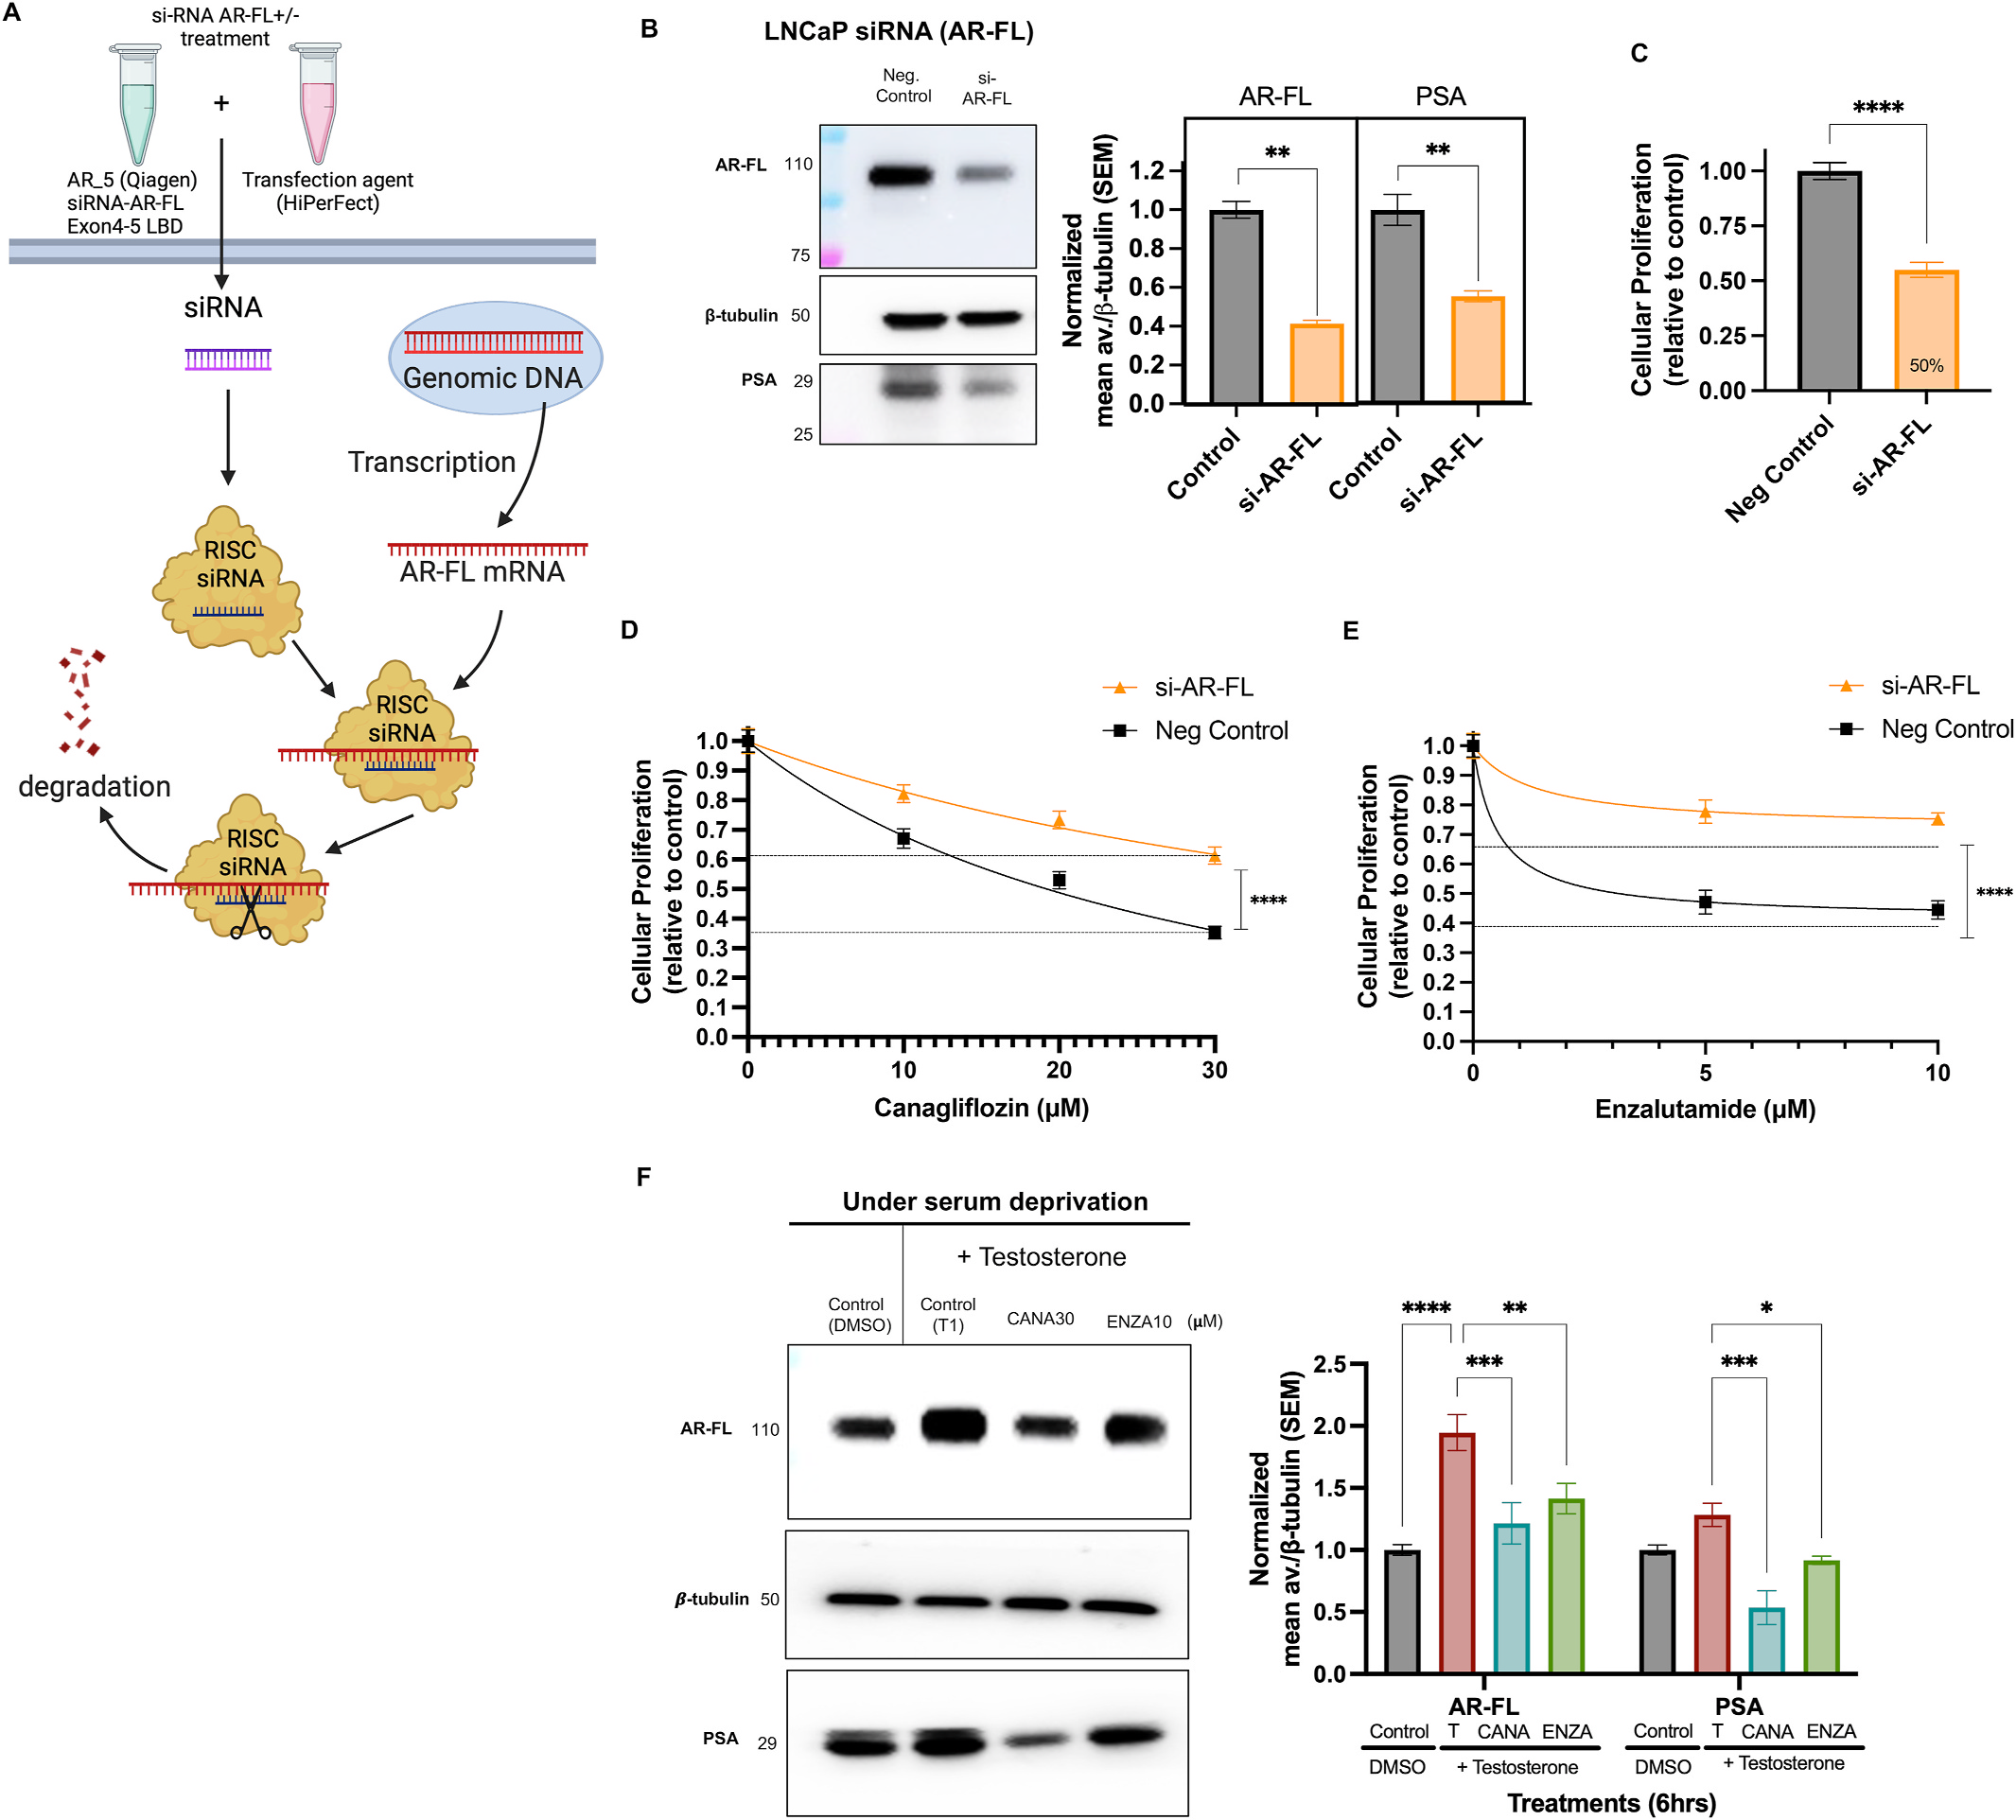
Fig. 4. AR-FL silencing generates resistance to canagliflozin in CSPC. (A) Schematic of AR-FL siRNA transfection in LNCaP (CSPC) cells (created with BioRender. com). (B) Immunoblot showing AR-FL and PSA levels in LNCaP cells transfected with si-AR-FL or negative control normalized to β-tubulin (±SEM, N = 3). Cellular proliferation of si-AR-FL transfected cells vs negative control in (C) untreated, (D) canagliflozin (0–30 μM) or (E) enzalutamide (0–10 μM) treated cells normalized to DMSO controls, (±SEM, N = 3). (F) Immunoblot and quantification of AR-FL and PSA in LNCaP treated with testosterone (1 μM) for 6 h, with or without canagliflozin (30 μM) or enzalutamide (10 μM). N = 3 and mean (±SEM) for all data. Statistical analysis One-way ANOVA with Tukey’s post hoc test performed: P < 0.05, P < 0.01, P < 0.001, P < 0.0001.(图注取自PDF文本层,来源:Cancer Letters, 2026)
第五步:物理层面证实——卡格列净确实"抱住"了AR-LBD
前面都是细胞层面的证据,作者还需要更硬的数据证明卡格列净和AR蛋白有直接的物理接触。他们用了三把"尺子":分子对接模拟、CETSA(细胞热位移实验)、SPR(表面等离子体共振)。
分子对接显示卡格列净与AR-LBD的结合口袋(CurPocket C3)有很好的匹配,Vina评分-8.5,跟阿帕他胺(-8.4)、达罗他胺(-8.5)相当,明显优于恩杂鲁胺(-7.6)。CETSA实验显示卡格列净处理能改变AR-FL的热稳定性——这是药物直接结合靶蛋白后产生的经典物理现象。SPR则直接测出了卡格列净与AR-LBD结合的Kd值是302.7 nM,对比恩杂鲁胺的940.6 nM,亲和力还更高。
@方法论点评:这里用的三个方法从"计算预测→细胞原位验证→体外纯蛋白验证"构成了完整的证据链。SPR是验证药物-蛋白直接结合的金标准,Kd值在nM级别也说明这个"脱靶"结合并非弱相互作用,是有生理意义的。

Fig. 5. Canagliflozin directly interacts with the Androgen Receptor Ligand Binding Domain (AR-LBD). All panels (A–D) were performed using molecular docking with CB-DOCK2 and ligand structures were obtained from PubChem (Structure Data File, SDF format). (A) Illustrates a 3D structure of the AR-LBD (Protein Data Bank (PDB): 2PIW). (B) AR-LBD sequence identifying predicted canagliflozin binding sites. (C) Identified binding cavities ranked by volume and color-coded by sequence location as shown in (B). (D) Molecular docking of canagliflozin or antiandrogens (enzalutamide, apalutamide, darolutamide) predicts their interaction to the AR-LBD, showing binding affinities (Vina scores), binding sites, and interaction bonds (E) An illustrative workflow of Cellular Thermal Shift Assay (CETSA) in living cells treated with vehicle or canagliflozin across increasing temperatures (created with BioRender.com). (F) CETSA was performed in 22RV1 cells treated ± canagliflozin (30 μM) for 1 h, and soluble protein fractions were analyzed by immunoblotting to assess AR stabilization, (±SEM, N = 3). At each temperature, control and drug-treated samples were compared using paired t-tests with false discovery rate correction (two-stage Benjamini–Krieger–Yekutieli). (G) A diagram illustrates the Surface Plasmon Resonance (SPR) assay used to assess the direct interaction between AR-LBD and another molecule (created with BioRender.com). (H) Steady- state Surface Plasmon Resonance (SPR) binding curves of AR-LBD with canagliflozin or enzalutamide are shown in RU at concentrations of 0.195, 0.390, 0.781, and 1.56 μM, with values normalized to DMSO controls (±SEM, N = 3). Equilibrium dissociation constants (Kd) were determined by nonlinear regression using a one-site specific binding model. Data points represent measured RU values, and curves indicate best-fit steady-state binding models. (For interpretation of the references to color in this figure legend, the reader is referred to the Web version of this article.)(图注取自PDF文本层,来源:Cancer Letters, 2026)
第六步:核心机智——卡格列净怎么连"缺了LBD"的AR-V7也能降解?
卡格列净能结合AR-LBD,这能解释它对AR-FL的作用。但AR-V7恰恰缺了LBD,它为啥也能被卡格列净干掉?这就引出了下一个推理环节。
作者用shRNA分别敲低AR-FL和AR-V7,然后把它们的转录组变化跟卡格列净处理的转录组做比较。结果发现三组确实有不少重叠的基因变化,但卡格列净调控的基因范围远大于单纯的AR-FL或AR-V7敲低。更重要的是,RNA-seq数据里泛素-蛋白酶体通路的基因被卡格列净显著调控,E3连接酶(如SIAH-1、MDM2)上调,多个HSP家族成员下调,其中HSP70(HSPA1A)尤其显著。
这个线索一出来,逻辑就串起来了:AR的稳定性依赖HSP70等分子伴侣的维护。如果HSP70被压制,AR蛋白就"没人罩着"了,容易被泛素化标记然后被蛋白酶体降解。即便AR-V7没有LBD,它的NTD区域依然依赖HSP70来维持稳定。
他们接着用蛋白酶体抑制剂MG-132做阻断实验:加MG-132后卡格列净就降不动AR了。免疫共沉淀进一步证实,卡格列净处理增强了AR的泛素化修饰。CHX(蛋白合成抑制剂)实验也排除了"抑制合成"的干扰——卡格列净加CHX比单用CHX降AR更多,说明主要是降解在起作用。
@方法论点评:这里作者做了两路机制挖掘:一路是"谁在上游"—HSP70下调导致AR失去保护;一路是"谁在下游"—泛素化增强、蛋白酶体负责清除。用MG-132阻断然后用IP看泛素化,把"降解"这个抽象概念变成了看得见的泛素条带,非常扎实。整个推理链条是:AR稳定性依赖HSP70 → 卡格列净下调HSP70 → AR失去保护 → 泛素化增加 → 蛋白酶体降解,包括AR-V7。

Fig. 6. Canagliflozin mimics silencing of AR-FL and AR-V7 in CRPC. (A) Graph illustrating 22RV1 cells transduced with shRNA targeting AR-FL (exon 5) or AR- V7 (CE3), or cells treated with canagliflozin, followed by RNA sequencing (RNA-seq) analysis (created with BioRender.com). (B) Immunoblotting analysis of AR-FL, AR-Vs, AR-V7, and PSA levels and their quantification normalized to β-actin, (±SEM, N = 3), in vehicle (sh-SCR), sh-AR-V7 and sh-AR-FL transduced cells. Data are presented as mean ± SEM from three independent experiments (N = 3). One-way ANOVA with Tukey’s post hoc test performed: p < 0.05, p < 0.01, p < 0.001, p < 0.0001. (C–D) Venn diagrams of significantly (FDR <0.05) (C) upregulated or (D) downregulated genes from RNA-seq of wild-type 22RV1 canagliflozin- treated (30 μM for 24h), sh-AR-FL, or sh-AR-V7 22RV1 cells compared to wild-type controls, with heatmaps showing shared differentially expressed genes and Reactome pathway enrichment. Genes labeled at the top of the heatmaps represent randomly selected examples of differentially regulated genes, and Reactome pathways are summarized below each heatmap. RNA-seq analyses were performed using three independent biological replicates (N = 3), denoted as A, B, and C for each group.(图注取自PDF文本层,来源:Cancer Letters, 2026)
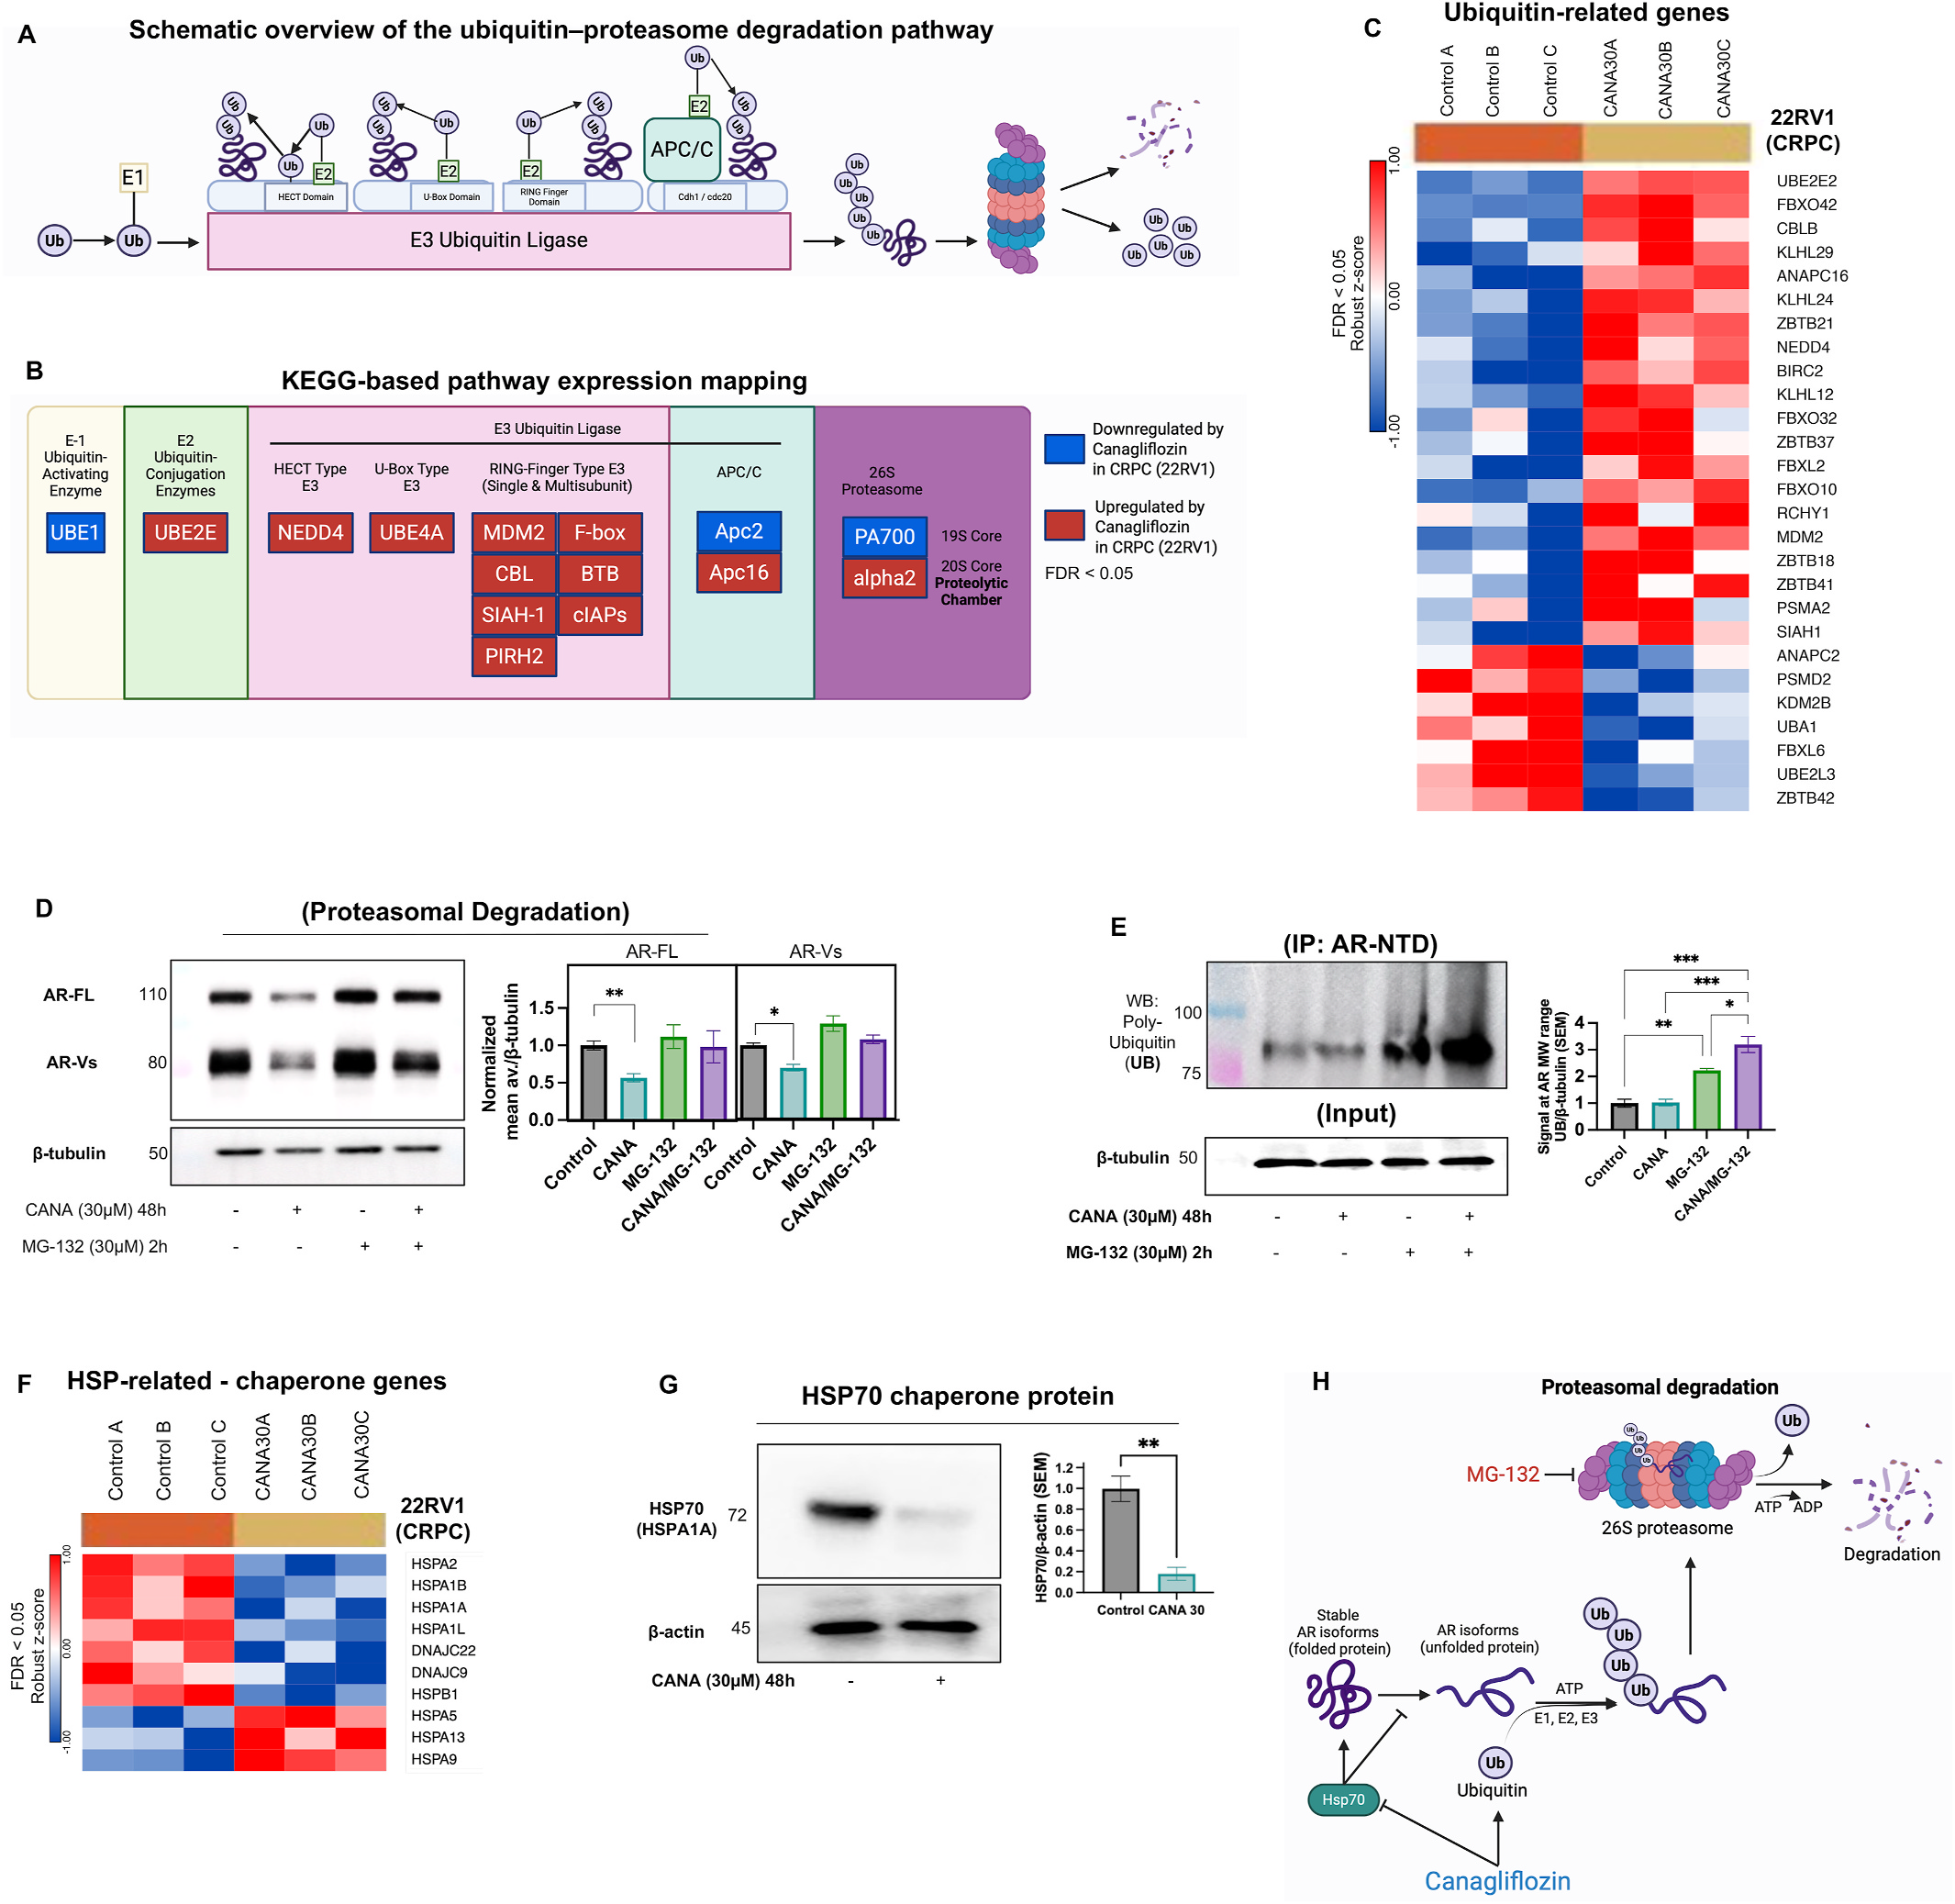
Fig. 7. Canagliflozin promotes proteasomal degradation of AR and AR variants in 22RV1 (CRPC) cells. (A) Schematic overview of the ubiquitin–proteasome degradation pathway, illustrating ubiquitin activation (E1), conjugation (E2), substrate recognition by E3 ubiquitin ligases (including HECT, U-box, RING-finger, and APC/C complexes), and subsequent proteasomal degradation (created with BioRender.com). (B) KEGG-based map of ubiquitin–proteasome system components showing differentially expressed genes in 22RV1 (CRPC) cells following canagliflozin treatment. Genes significantly downregulated (blue) or upregulated (red) are indicated (FDR <0.05) (created with BioRender.com). (C) Heatmap of differentially expressed ubiquitin–proteasome–related genes in canagliflozin-treated 22RV1 cells, filtered by FDR <0.05. (D) Immunoblot analysis showing that proteasome inhibition with MG-132 prevents canagliflozin-induced degradation of AR-FL and AR- Vs in 22RV1 cells, with corresponding densitometric quantification normalized to β-tubulin and presented as mean (±SEM, N = 3). (E) Immunoprecipitation (IP) of AR using an anti-AR-NTD antibody, followed by immunoblotting (WB: UB) for poly-ubiquitin, showing accumulation of poly-ubiquitinated AR upon proteasome inhibition with MG-132, with further enhancement in the presence of canagliflozin (lysates were BCA-quantified and normalized prior to splitting into input 10% and IP fractions), and densitometric quantification was normalized to β-tubulin from the corresponding input samples (±SEM, N = 3). (F) Heatmap showing differentially expressed HSP-related chaperone genes in 22RV1 (CRPC) cells following canagliflozin treatment based on RNA-seq analysis. Colors represent relative gene expression changes (red, upregulated; blue, downregulated). (G) A representative immunoblot validation of the selected HSP-related chaperone HSP70 (HSPA1A) at the protein level, with corresponding loading controls. (H) Schematic model depicting canagliflozin-induced AR ubiquitination and proteasome-mediated degradation. Cana gliflozin disrupts HSP70-mediated AR stability, promoting AR ubiquitination and subsequent degradation by the 26S proteasome, which is inhibited by MG-132 (created with BioRender.com). Data are presented as mean ± SEM from three independent biological replicates (N = 3). Statistical analyses were performed using unpaired two-tailed Student’s t-test or one-way ANOVA with Tukey’s post hoc test, as appropriate: p < 0.05, p < 0.01, p < 0.001, p < 0.0001. (For interpretation of the references to color in this figure legend, the reader is referred to the Web version of this article.)(图注取自PDF文本层,来源:Cancer Letters, 2026)
第七步:临床意义——这套转录组特征跟患者预后挂钩
机制搞清楚了,但最终的问题是:这在患者身上有意义吗?他们用GSE16560临床队列做了预后分析。结果很抢眼:卡格列净下调的基因集高表达与差预后相关,HR = 10.69,p = 3.27e-07。而单纯敲低AR-FL的基因集在预后分析里不显著。PCTA数据库的分层分析进一步提示,卡格列净的"雄激素应答"相关调控在局限性肿瘤里更明显,而"MYC/细胞周期/DNA修复"相关调控在转移性CRPC里更突出——这意味着它在不同疾病阶段可能有不同的作用侧重点。
@方法论点评:这里用临床数据库做"反向验证":不是看患者有没有吃卡格列净,而是看"卡格列净调控的这套基因特征"在患者中表现如何。这是一种经典的"基因特征预后分析"策略,用来评估一个药物作用模式的临床相关性,而不用等临床数据本身。

Fig. 8. Prognostic value of canagliflozin’s transcriptional program. (A) Schematic illustrating the workflow used to evaluate the prognostic relevance of gene expression changes induced by canagliflozin in 22RV1 cells (created with BioRender.com). (B–C) Kaplan–Meier survival curves illustrating the association of (B) the canagliflozin transcriptional program and (C) the sh-AR-FL transcriptional program, defined by genes significantly downregulated in 22RV1 cells based on GSEA of downregulated pathways (FDR <0.05), with overall survival Cohort from GSE 16560, divided at the median of gene expression (plots generated using PROGgeneV2; proggene.ccbb.indianapolis.iu.edu). (D) Gene set enrichment analysis (GSEA) of canagliflozin-downregulated genes (FDR <0.05) using the Prostate Cancer Tran scriptome Atlas (PCTA), comparing localized primary prostate cancer with metastatic castration-resistant prostate cancer (mCRPC) (plots generated using PCTA; th epcta.org).(图注取自PDF文本层,来源:Cancer Letters, 2026)
核心结论
这篇研究证明卡格列净是一个被重新发现的AR通路抑制剂,作用机制是双管齐下:一方面直接结合AR-LBD阻断信号,另一方面通过下调HSP70、增强泛素化,促进AR-FL和AR-V7的蛋白酶体降解。后者是它的独家优势——传统ARPI对AR-V7基本束手无策。

Fig. 9. Mechanism of canagliflozin’s anti-androgen activity in prostate cancer. Canagliflozin, a clinically approved metabolic therapy, directly interacts with the ligand-binding domain (LBD) of AR-FL and induces proteasomal degradation of AR-FL and its variants (including AR-V7), leading to substantial disruption of AR signaling. Canagliflozin suppresses HSP70 expression and increases AR ubiquitination and degradation. In parallel, canagliflozin induces expression of E3 ubiquitin ligase–related genes at the transcriptional level (including SIAH-1 and MDM2). These combined effects are accompanied by reduced nuclear and cytosolic levels of AR-FL and AR-Vs (including AR-V7), transcriptional reprogramming of CSPC and CRPC gene expression, and inhibition of prostate cancer growth.(图注取自PDF文本层,来源:Cancer Letters, 2026)
对耐药/DTP/PGCC 的启示
AR-V7靶向策略的新思路。目前对付AR-V7的主要策略是PROTAC或反义寡核苷酸,但都还没走到临床。这篇工作提供了一个出人意料的思路:用已获批、安全性好的降糖药来实现AR-V7降解。如果后续临床研究验证有效,可以很快转化。
药物耐受持久细胞(DTP)的可能干预点。DTP的一大特征是对常规治疗的"休眠性"耐受,AR信号的重新激活(即使在没有雄激素的情况下)是DTP复苏的重要机制之一。卡格列净同时清除AR-FL和AR-V7,理论上比传统ARPI更能"釜底抽薪",可能延缓或阻止DTP向复发肿瘤的转变。
多靶点效应的优势。卡格列净除了AR,还影响E2F、MYC、DNA修复等通路,而且它在转录组层面的调控范围远大于单纯的AR敲低。这种多靶点特性对于应对PGCC等异质性强的耐药细胞群可能更有优势,因为PGCC的形成和复苏往往涉及多条通路的协同改变,单靶点药物容易被"绕过"。
局限
药代动力学浓度问题。人体口服卡格列净(300 mg)的Cmax大约在1.1-7.9 μM,而本研究中大量实验使用的是30 μM。虽然有文献提到亚舌纳米晶或静注可达更高浓度,但口服常规给药能否在肿瘤组织达到30 μM是悬而未决的问题。文中提到饮食给药50 mg/kg/day可达到低微摩尔血浆浓度,但这个水平是否足以产生细胞实验中观察到的全效应,还需要更精确的药物组织分布数据。
AR-V7的降解机制在纯蛋白层面没验证。分子对接、SPR针对的是AR-LBD,那对于AR-V7(没有LBD)的降解,虽然通过细胞实验和泛素化证据间接证明是HSP70通路,但缺乏"卡格列净与AR-V7是否有直接相互作用"的生化证据。卡格列净对AR-V7的作用究竟是通过影响HSP70间接导致的,还是也有直接结合,文中未完全厘清。
临床队列的分析并非卡格列净治疗数据。预后分析用的是基因表达特征,而不是真正用药患者的生存数据。这只能提供"机制相关性的证据",还不能替代真正的临床用药观察或前瞻性临床试验。
来源
期刊:Cancer Letters,2026。DOI: 10.1016/j.canlet.2026.218535