一句话亮点
这篇《Cancer Letters》研究发现,FN14在横纹肌肉瘤(RMS)中高表达,不依赖其配体TWEAK,而是通过激活ERK1/2信号、增强线粒体氧化磷酸化来驱动肿瘤增殖和化疗耐药;反过来,敲低FN14或抑制ERK1/2能把耐药细胞"拽"回分化轨道。对于耐药/持久细胞(DTP)来说,FN14-ERK1/2-线粒体代谢轴可能是它们"休眠-复苏"的一个代谢开关。
背景/痛点
横纹肌肉瘤是儿童最常见的软组织肉瘤,治疗上棘手之处有两点:第一,约1/3患者最终对标准化疗(主要是长春新碱)产生耐药;第二,这种肿瘤细胞明明表达成肌调控因子,却"赖"在细胞周期里不肯退出,无法完成终末分化。这两个问题背后的分子机制一直没完全说清楚。
FN14这个受体之前多被关注在组织修复和肌肉再生中——作者的课题组已经报道过Fn14调控肌肉卫星细胞的融合和自我更新。但在肿瘤里,FN14在多个癌种中高表达且与预后不良相关,唯独在RMS里没人碰过。更关键的是,FN14究竟是通过配体TWEAK激活,还是单纯靠过表达"自激活"下游信号,在不同肿瘤里结论不一。
@方法论点评:这篇文章一上来就选了一个"机制模糊但临床关联明确"的切入点——FN14在别的癌种有线索,但在RMS是空白;作者用"已知的未知"来论证研究的必要性,比"我随便筛了个分子"更有说服力。
推理链分步拆解
第一步:先看FN14在RMS里到底有没有异常表达
作者首先分析了公共RNA-seq数据(GSE108022),发现FN14的mRNA在融合阳性和融合阴性的RMS样本里都比正常肌肉高出一大截,但配体TWEAK基本没变化。接着在RD(胚胎型)和RH30(腺泡型)两个细胞系里验证了蛋白水平,确认FN14高表达。TCGA泛癌分析显示FN14高表达的患者总生存更差。
https://example.com/placeholder.png

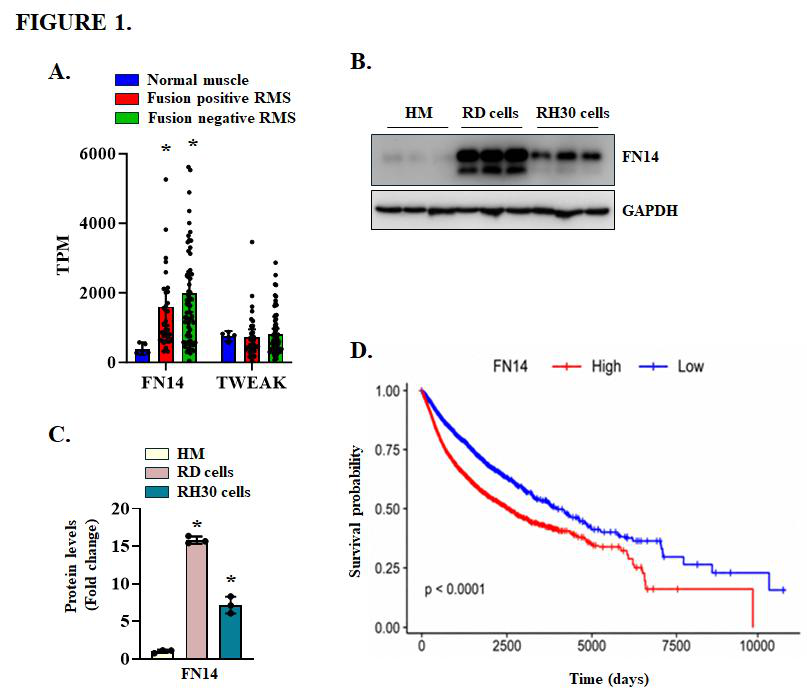
Fig. 1. Expression of FN14 in RMS cell lines and tumor samples. (A) Relative mRNA levels of TWEAK and FN14 obtained from analysis of RNA-Seq dataset (GSE108022) containing 5 normal human muscles, 28 FP-RMS and 51 FN-RMS samples. p < 0.05, values significantly different from normal muscle samples by unpaired Student t test. (B) Representative immunoblots, and (C) densitometry analysis showing levels of FN14 and unrelated protein GAPDH in human myoblasts (HM) and RD and RH30 cell lines. n = 3 biological replicates in each group. Data presented as mean ± SD. p<0.05, values significantly different from human muscle by unpaired Student t test. (D) TCGA data analysis of Pan-Cancer samples shows worse overall survival for patients having tumors with high FN14 expression. A median cut-off point was used for the analysis (High, n=4277 and low, n=4238).(图注取自PDF文本层,来源:Cancer Letters, 2026)
@方法论点评:这一步是"表型确认"——用公共数据+自家实验交叉验证,确保FN14高表达不是某个数据集或某个细胞系的偶然事件。配体没变而受体变,暗示FN14可能是"孤狼"模式在起作用。
第二步:那么FN14高表达是"乘客"还是"司机"?
作者用两条独立shRNA敲低FN14,发现RD和RH30的细胞数明显减少、EdU掺入降低、克隆形成能力下降。软琼脂实验也证实锚定非依赖性生长受抑——这是转化细胞的金标准。体内实验用Tet-On诱导敲低系统,多西环素给药后前3周肿瘤生长被显著抑制,但第4周出现逃逸,肿瘤大小恢复。
https://example.com/placeholder.png
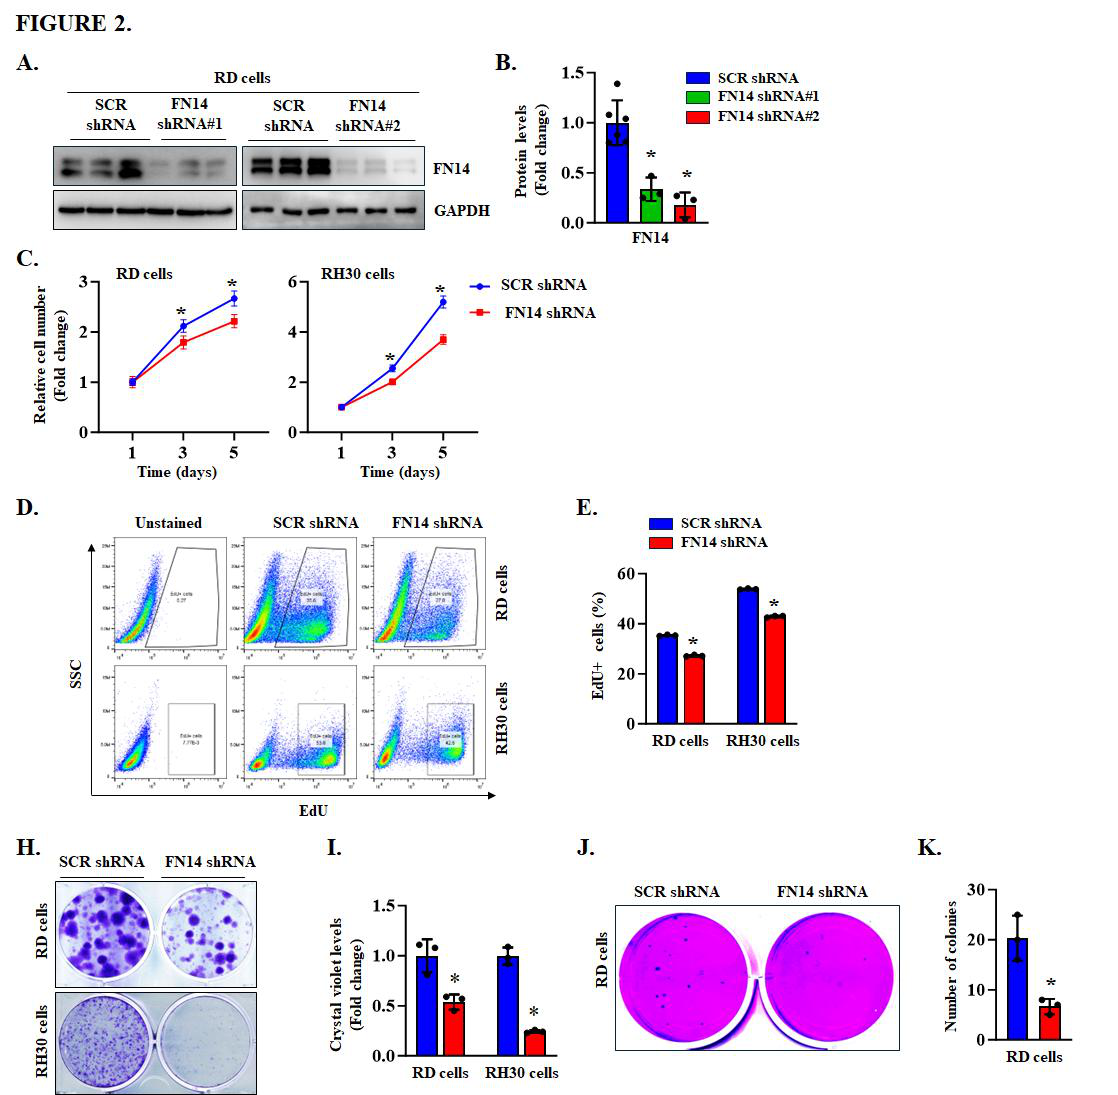
Fig. 2. FN14 regulates the proliferation of RMS cells. (A) Representative immunoblots showing FN14 protein levels in RD cells expressing scrambled shRNA or two independent FN14 targeting shRNAs. (B) Quantification of relative FN14 protein levels in control and FN14 knockdown RD cells. (C) Growth curves showing the relative number of RD and RH30 cells expressing scrambled shRNA or FN14 shRNA #2 at the indicated time points. (D) Representative flow cytometry scatter plots showing proportion of EdU+ cells in control and FN14 knockdown RD and RH30 cells. (E) Quantification of the proportion of EdU+ cells in control and FN14 knockdown RD and RH30 cells. (F) Representative images of clonogenic assays and (G) quantification of crystal violet staining in control and FN14 knockdown RD and RH30 cells. (H) Representative images of soft agar assays and (I) quantification of colony numbers in control and FN14 knockdown RD cells. Data are presented as mean ± SD. p<0.05, values significantly different from the corresponding scrambled shRNA control by unpaired Student t test.(图注取自PDF文本层,来源:Cancer Letters, 2026)
@方法论点评:这里关键的设计是用"两条shRNA"交叉验证,避免脱靶效应。体内用诱导性敲低而非组成性敲除,模拟"药物干预"的场景,更贴近临床——但第4周逃逸现象也预示了单纯靶向FN14可能不会一劳永逸。@方法论点评:软琼脂实验经常被忽略但很重要——它测的是"不依赖贴壁就能长"的能力,跟体内成瘤能力更相关,比普通增殖实验的转化意义更大。
第三步:FN14靠什么机制干活?配体还是下游信号?
作者用L524-0366这个小分子阻断TWEAK-FN14结合,结果对RD增殖和克隆形成毫无影响——说明在RMS里FN14走的是"不依赖配体"的路子。那它依赖什么?Western blot显示敲低FN14选择性地降低了ERK1/2磷酸化,p38 MAPK不受影响。在长春新碱耐药的RD细胞里,p-ERK1/2水平更高,而敲低FN14又能把它压下来。
有趣的是,用U0126抑制ERK1/2之后,耐药细胞里的FN14蛋白本身也下降了——说明存在"FN14↔ERK1/2"的正反馈调节,而且这个正反馈在耐药状态下更强。
https://example.com/placeholder.png
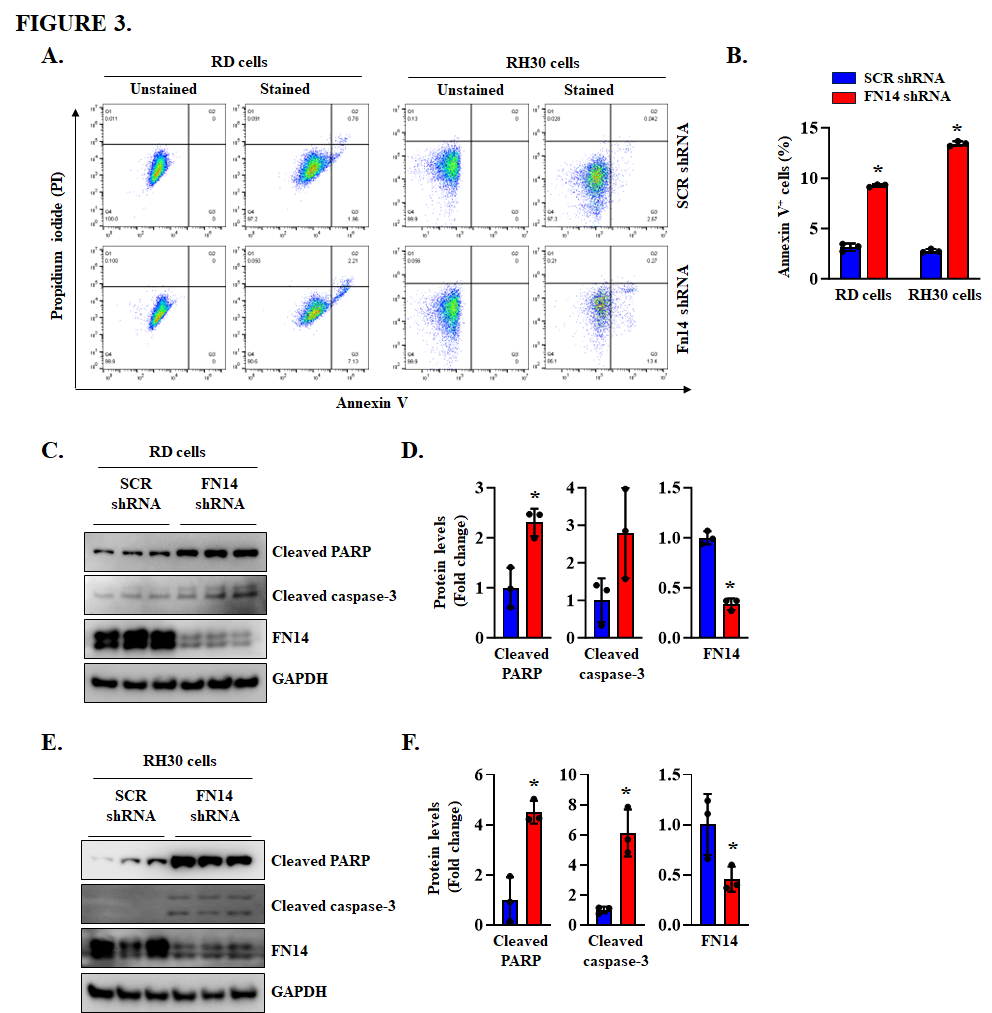
Fig. 3. FN14 knockdown reduces the viability of RMS cells. (A) Representative flow cytometry scatter plots showing Annexin V-positive cells in control and FN14 knockdown RD and RH30 cells. (B) Quantification of the percentage of Annexin V-positive cells in control and FN14 knockdown RD and RH30 cells measured by FACS analysis. (C) Representative immunoblots, and (D) densitometry analysis showing the levels of cleaved PARP, cleaved caspase-3, and FN14 protein in control and FN14 knockdown RD cells. (E) Representative immunoblots and (F) densitometry analysis showing the levels of cleaved PARP, cleaved caspase-3, and FN14 protein in control and FN14 knockdown RH30 cells. For all quantifications, n=3 independent experiments per group. Data are presented as mean ± SD. p<0.05, values significantly different from the corresponding scrambled shRNA determined by unpaired Student t test(图注取自PDF文本层,来源:Cancer Letters, 2026)
https://example.com/placeholder.png
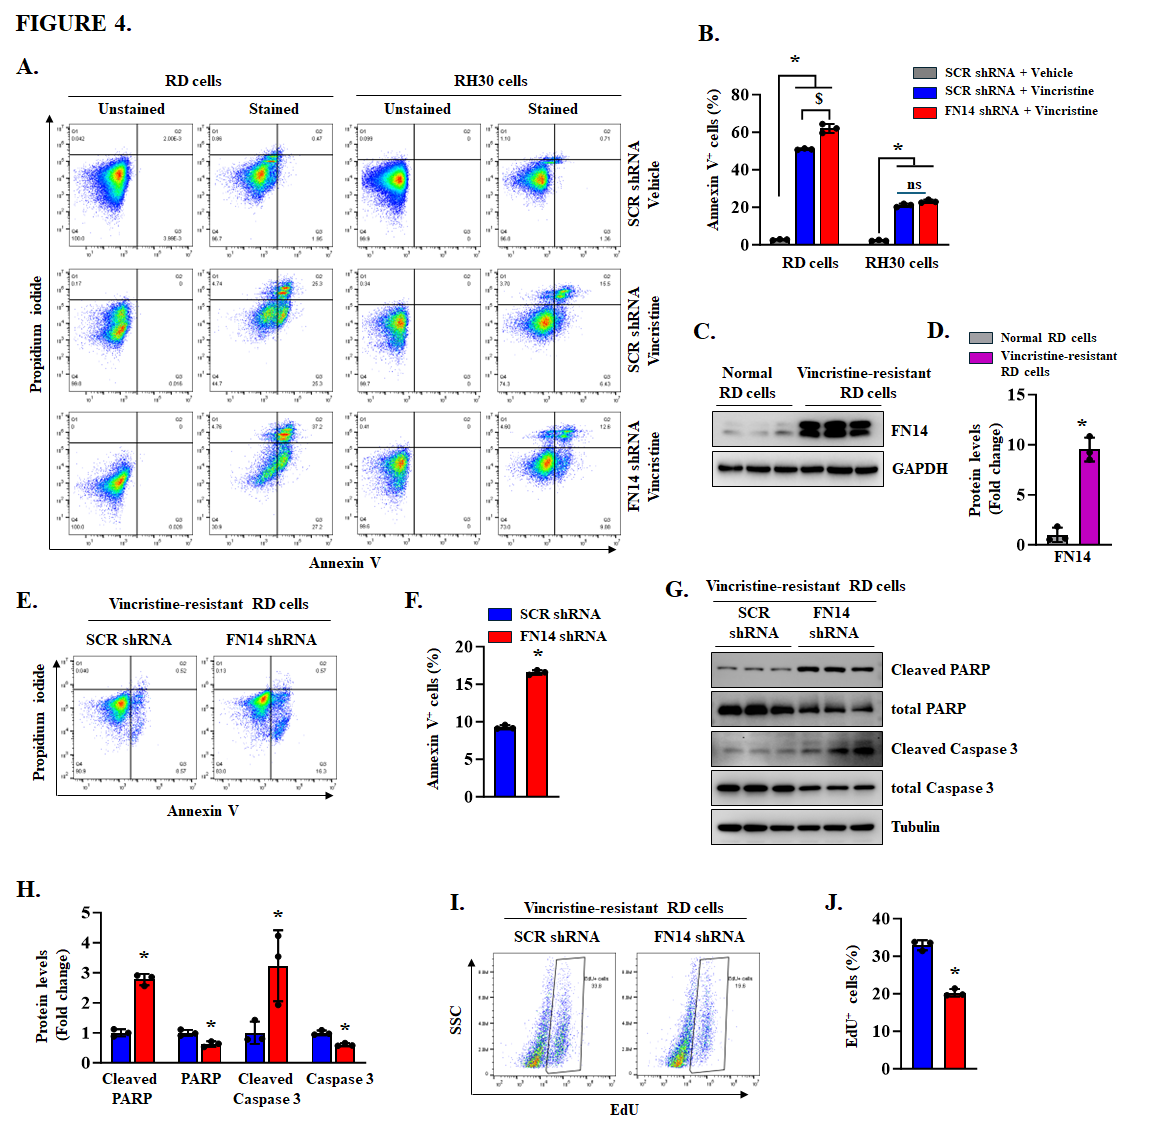
Fig. 4. FN14 knockdown sensitizes RD and vincristine-resistant RD cells to vincristine-induced cell death. (A) Representative flow cytometry scatter plots and (B) quantification of FACS-based analysis showing the percentage of Annexin V positive cells in control and FN14 knockdown RD and RH30 cells treated with vehicle alone or 2 nM vincristine for 72 h. (C) Representative immunoblots and (D) quantification of FN14 protein levels in parental (normal) RD cells and vincristine-resistant RD cells. (E) Representative flow cytometry scatter plots and (F) quantification of Annexin V positive cells in control and FN14 knockdown vincristine-resistant RD cells. (G) Representative immunoblots showing the levels of cleaved PARP, total PARP, cleaved caspase-3, total caspase-3, and an unrelated protein tubulin in control and FN14 knockdown vincristine-resistant RD cells. (H) Quantification of relative protein levels in control and FN14 knockdown vincristine-resistant RD cells. (I) Representative flow cytometry(图注取自PDF文本层,来源:Cancer Letters, 2026)
https://example.com/placeholder.png
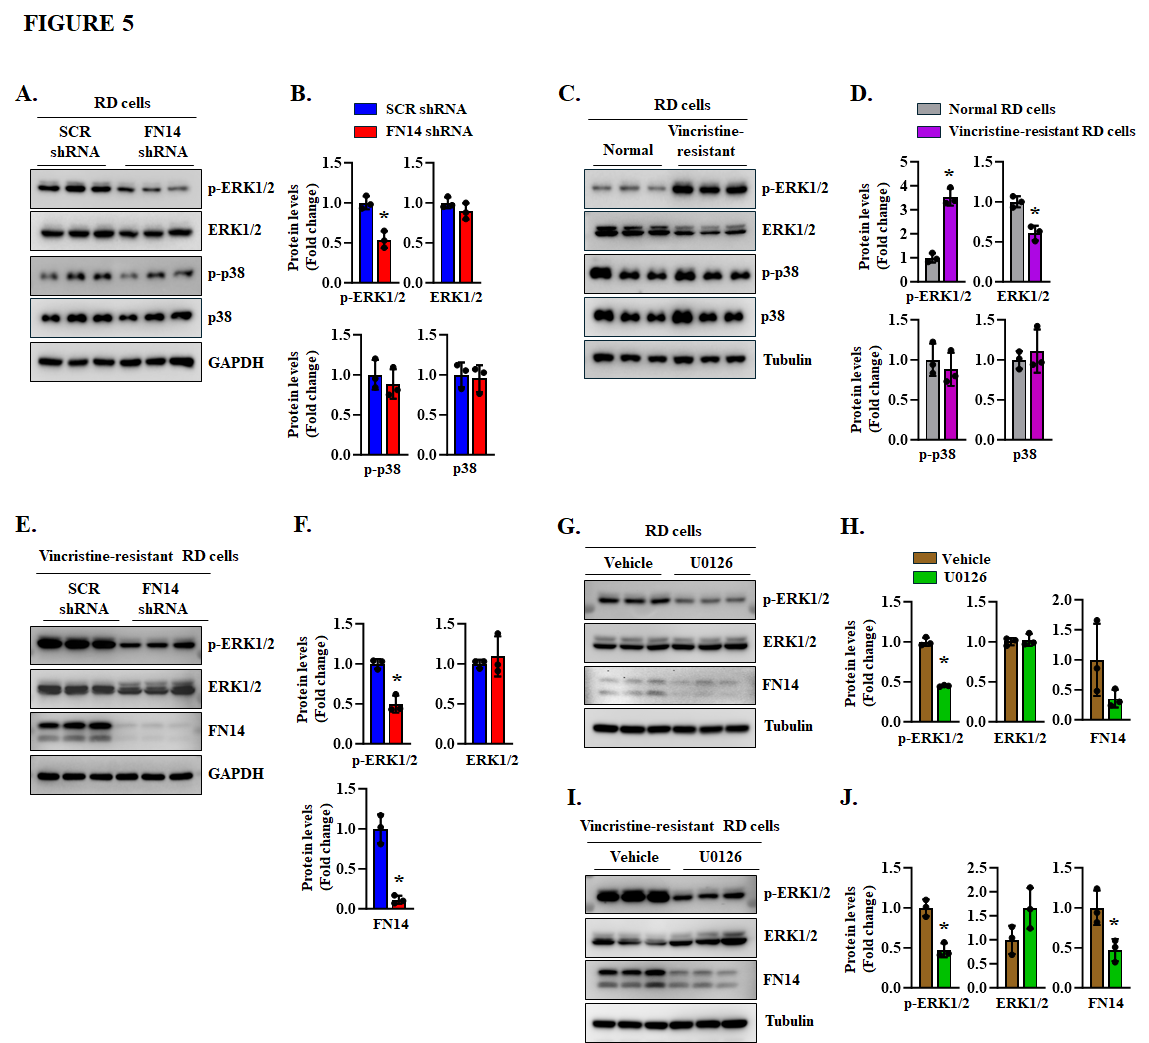
Fig. 5. FN14 modulates ERK1/2 signaling in RD cells. (A) Representative immunoblots showing the levels of phosphorylated ERK1/2 (p-ERK1/2), total ERK1/2, phosphorylated p38 (p-p38), total p38, and GAPDH in control and FN14 knockdown RD cells. (B) Quantification of relative protein levels in control and FN14 knockdown RD cells. (C) Representative immunoblots showing the levels of p-ERK1/2, total ERK1/2, p-p38, total p38, and tubulin in parental and vincristine-resistant RD cells. (D) Quantification of relative protein levels in parental RD cells and vincristine-resistant RD cells. (E) Representative immunoblots and (F) quantification of the relative levels of p-ERK1/2, total ERK1/2, and FN14 in control and FN14 knockdown vincristine-resistant RD cells. (G) Representative immunoblots and (H) quantification of relative protein levels in RD cells treated with vehicle alone or the MEK inhibitor U0126 (5 ng/ml). (I) Representative immunoblots, and (J) quantification of relative protein levels in vincristine-resistant RD cells treated with vehicle alone or 5 ng/ml U0126. For all quantifications, n=3 independent experiments per group. Data are presented as mean ± SD. p < 0.05, values significantly different from corresponding control group analyzed by unpaired Student t test.(图注取自PDF文本层,来源:Cancer Letters, 2026)
https://example.com/placeholder.png
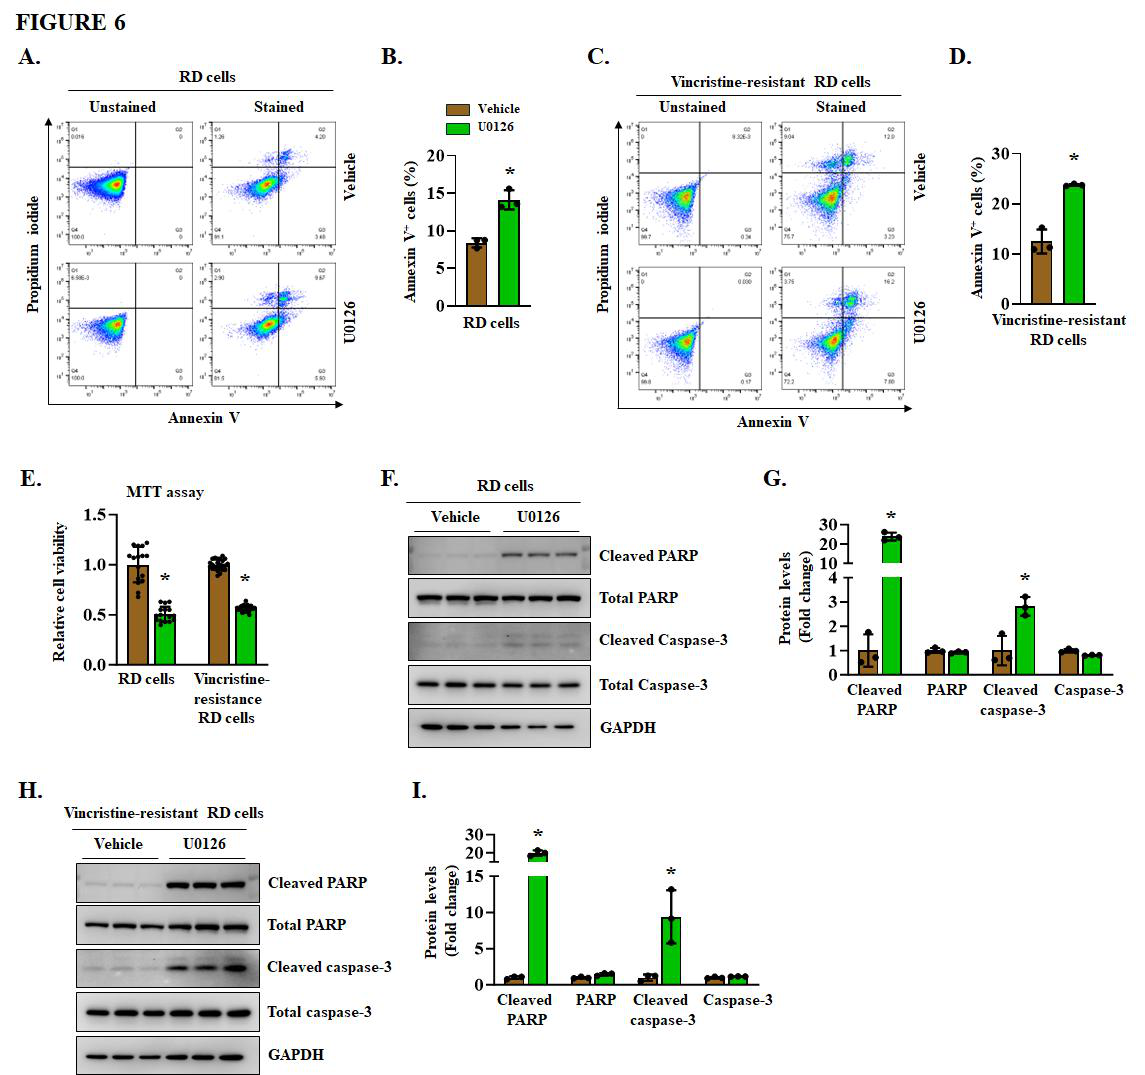
Fig. 6. Pharmacological inhibition of ERK1/2 signaling induces cell death in RD cultures. (A) Representative flow cytometry scatter plots, and (B) quantification of FACS-based analysis showing the percentage of Annexin V positive cells in RD cells treated with vehicle alone or the MEK inhibitor U0126 (5 ng/ml) for 72 h. (C) Representative flow cytometry scatter plots and (D) quantification of FACS-based analysis showing the percentage of Annexin V positive cells in vincristine-resistant RD cells treated with vehicle alone or U0126 (5 ng/mL) for 72 h. (E) MTT assay showing relative cell viability of parental RD cells and vincristine-resistant RD cells treated with vehicle alone or 5 ng/ml U0126. (F) Representative immunoblots and (G) quantification of relative protein levels of cleaved PARP, total PARP, cleaved caspase-3, total caspase-3, and GAPDH in RD cells treated with vehicle alone or 5 ng/ml U0126. (H) Representative immunoblots and (I) quantification of relative protein levels of cleaved PARP,(图注取自PDF文本层,来源:Cancer Letters, 2026)
@方法论点评:这一步做得比较扎实——先用抑制剂排除配体依赖,再往下游看信号通路,最后用"耐药细胞里两者都升高"和"抑制ERK1/2后FN14也下降"两个证据建立"双向调控"的概念。这比单向"FN14→ERK1/2"更有深度,但也留下了一个问题:ERK1/2怎么反过来调控FN14?文中推测可能是AP-1转录因子结合FN14启动子(他们之前在肌肉里报道过),但在RMS里没直接证明,算是一个小缺口。
第四步:那FN14-ERK1/2对线粒体做了什么?
这是一个很有意思的延伸。作者用Seahorse测OCR发现:敲低FN14后基础呼吸、ATP-linked呼吸和最大呼吸都下降;长春新碱耐药细胞的OCR反而比亲本高;用U0126抑制ERK1/2能逆转耐药细胞的高OCR。p38抑制剂SB203580也有效果,但幅度不如U0126。
https://example.com/placeholder.png
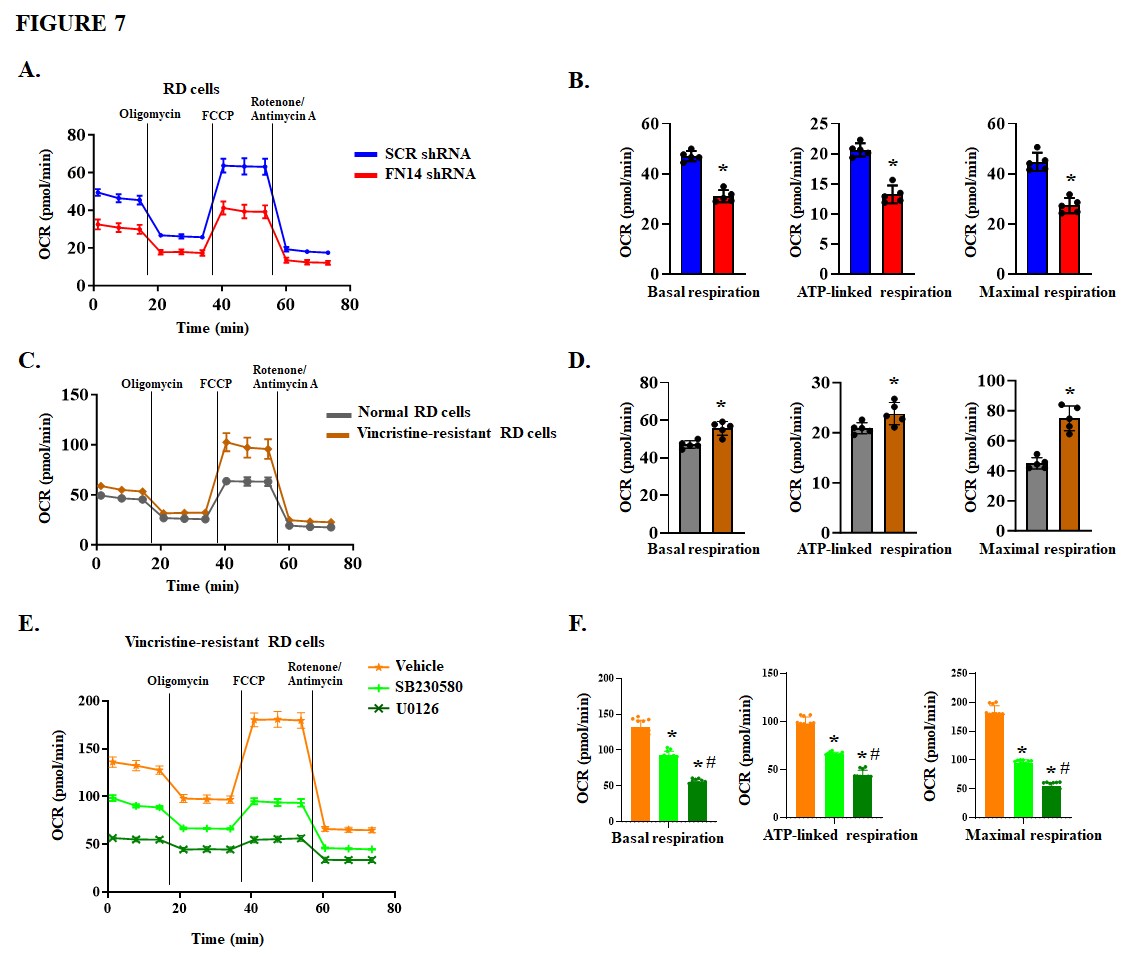
Fig. 7. Silencing of FN14 inhibits mitochondrial respiration in RMS cells. (A) Representative Seahorse extracellular flux traces showing oxygen consumption rate (OCR) in control and FN14 knockdown RD cells. (B) Quantification of basal respiration, ATP-linked respiration, and maximal respiration in control and FN14 knockdown RD cells. (C) Representative Seahorse OCR traces comparing parental RD cells and vincristine-resistant RD cells. (D) Quantification of basal, ATP-linked, and maximal respiration in parental and vincristine-resistant RD cells. n = 5 biological replicates per group. Results are presented as mean ± SD. (E) Representative Seahorse OCR traces of vincristine-resistant RD cells treated with vehicle alone, 5 ng/ml U0126, or 3.8 µg/ml SB 230580 for 18 h. (F) Quantification of basal, ATP-linked, and maximal respiration in vehicle, U0126, and SB 230580 treated vincristine- resistant RD cells. n = 5 biological replicates per group. Results are presented as mean ± SEM. p < 0.05, values significantly different from the corresponding vehicle-treated cultures by unpaired Student t test. #p < 0.05, values significantly different from the corresponding U0126- treated cultures by unpaired Student t test.(图注取自PDF文本层,来源:Cancer Letters, 2026)
@方法论点评:这一步把"增殖/存活"表型跟"代谢重编程"挂上了钩。@方法论点评:Seahorse测的是"即时"耗氧率,这里看到的是FN14调控线粒体功能的静态差异,但要想说"线粒体改变是原因而非结果",还需要做更动态的追踪(比如加药后的时程变化)。不过他们用TWEAK刺激实验验证了"FN14激活能增强呼吸",反向又敲低验证"FN14缺失降低呼吸",做了双向因果,已经很有说服力。
第五步:最关键的——分化怎么办?
RMS的"分化阻滞"是它的标志性病理特征。作者用MyHC(肌球蛋白重链)作为终末分化标志物,发现敲低FN14后MyHC阳性细胞比例显著增加;用U0126处理也得到同样的效果,而且在长春新碱耐药细胞里也同样有效。
https://example.com/placeholder.png
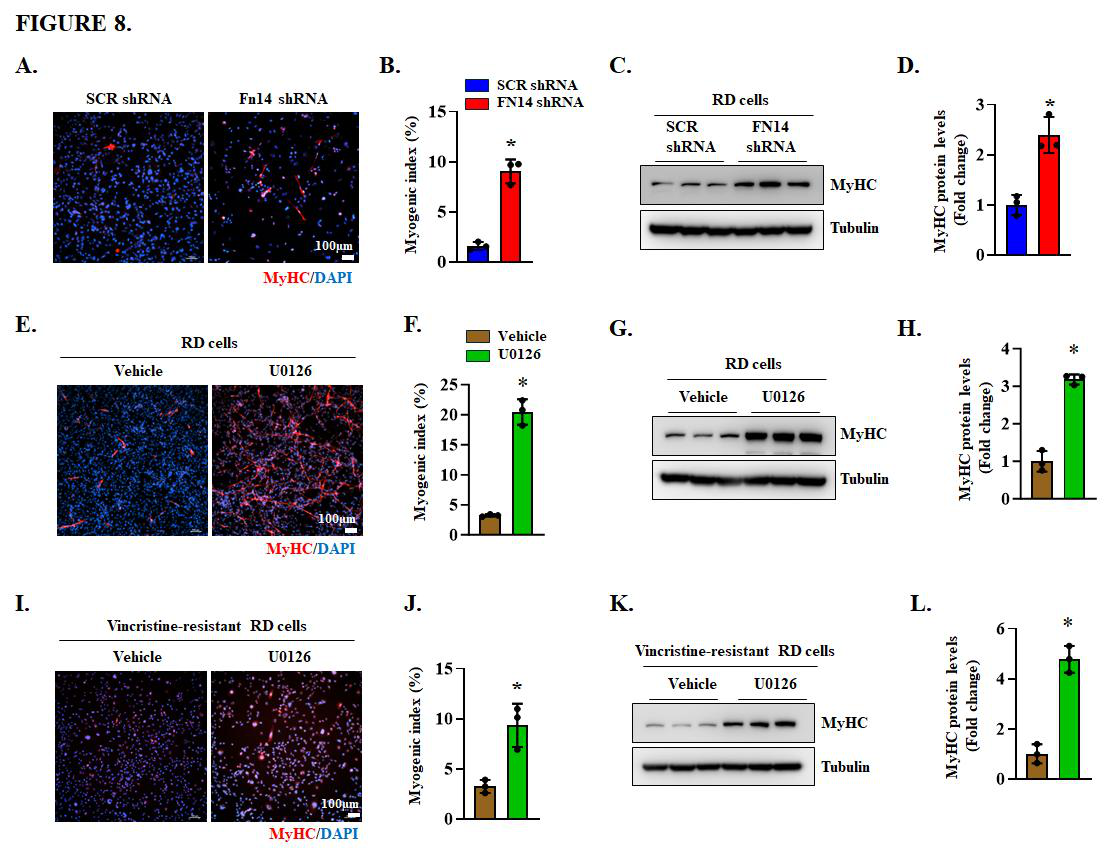
Fig. 8. FN14 knockdown or inhibition of ERK1/2 induces myogenic differentiation in RD cells. (A) Representative immunofluorescence images of control and FN14 knockdown RD cultures stained for myosin heavy chain (MyHC). Nuclei were counterstained with DAPI. Scale bar, 100 μm. (B) Quantification of the differentiation index in control and FN14 knockdown RD cells. (C) Representative immunoblots showing MyHC protein levels in control and FN14 knockdown RD cells. (D) Quantification of relative MyHC protein levels in control and FN14 knockdown RD cells. (E) Representative immunofluorescence images of RD cell cultures treated with vehicle alone or 5ng/ml U0126 and stained for MyHC protein. Nuclei were counterstained with DAPI. Scale bar, 100 μm. (F) Quantification of the differentiation index in vehicle- and U0126-treated RD cultures. (G) Representative immunoblots showing MyHC protein levels in vehicle alone and 5 ng/ml U0126 treated RD cultures. (H) Quantification of relative MyHC protein levels in vehicle- and U0126-treated RD cells. (I) Representative images of vincristine- resistant RD cultures treated with vehicle alone or 5 ng/ml U0126 and stained for MyHC. Nuclei were counterstained with DAPI. Scale bar, 100 μm. (J) Quantification of the differentiation index in vehicle- and U0126-treated vincristine-resistant RD cells. (K) Representative immunoblots showing MyHC protein levels in vehicle- and U0126 treated vincristine-resistant RD cells. (L) Quantification of relative MyHC protein levels in vehicle and U0126 treated vincristine-resistant RD cells. n = 5 biological replicates per group. Data are presented as mean ±(图注取自PDF文本层,来源:Cancer Letters, 2026)
@方法论点评:这一步把FN14-ERK1/2的功能从"促增殖、抗凋亡"延伸到"抑分化",相当于覆盖了RMS病理的三大维度。而且注意到,他们在耐药细胞上重复了分化实验——这很重要,因为临床上耐药细胞的"干性"或"去分化"状态更强,能在耐药背景下把分化拽回来,才是真正的治疗潜力。
核心结论
FN14在RMS里通过以下方式驱动恶性表型:
不依赖TWEAK配体,而是靠自身过表达激活下游ERK1/2(而非p38); 通过ERK1/2增强线粒体氧化磷酸化,为增殖和存活提供能量支持; 同时通过ERK1/2抑制终末成肌分化,维持肿瘤细胞的未分化状态; 在长春新碱耐药细胞中,FN14和ERK1/2形成正反馈环,进一步增强上述效应。
FN14-ERK1/2-线粒体代谢轴是RMS的一个核心驱动通路,也是化疗耐药的一个潜在脆弱点。
@方法论点评:整个逻辑链很完整:表型→功能验证(敲低+回复?这里缺了回复实验)→机制(信号通路+代谢)→病理意义(分化)→耐药场景延伸。美中不足的是没有做"FN14过表达能否回复敲低表型"的回复实验,因果强度稍打折扣,但考虑到用了两条独立shRNA和药理学抑制剂,整体结论仍然稳健。
对耐药/DTP/PGCC 的启示
这篇工作对耐药/持久细胞(DTP)领域有几个直接的启发:
① 代谢重塑可能是DTP的一个"燃料开关"。长春新碱耐药细胞的OCR升高,说明DTP可能不是单纯"休眠"降低能耗,反而可能在耐药状态下依赖增强的线粒体OXPHOS维持生存。这让人联想到一些文献报道的"耐药细胞转向氧化磷酸化"的现象,FN14-ERK1/2可能是调控这一转变的上游信号之一。
② “分化-增殖"二选一的理论有了新证据。敲低FN14或抑制ERK1/2能把RD细胞推向分化,而在耐药背景下同样有效——提示一个很有趣的可能性:我们不需要直接杀死DTP,而是通过打断FN14-ERK1/2信号,强迫它们分化退出细胞周期,从而解除耐药状态。这跟"分化治疗"的思路一致(比如ATRA在白血病中的应用),但在肉瘤里探索得很少。
③ 正反馈调节意味着"阈值效应”。FN14和ERK1/2之间的正反馈暗示,一旦进入耐药状态,这个环路可能被锁定在高活性水平。反过来想,如果能在早期打断这个正反馈,可能比在晚期抑制单靶点更有效。这也解释了为什么体内诱导敲低FN14只能延缓而不能根治肿瘤——可能因为残留的FN14足以重新驱动ERK1/2,或者有其他旁路补偿(文中没测,但提到了"代偿机制")。
@方法论点评:DTP的一个重要特征是"非遗传性耐药",这篇文章虽然没有直接提DTP/PGCC,但"长春新碱耐药细胞"的模型本质上就是在富集适应性的细胞群体。如果能进一步分选出DTP亚群(比如通过PKH26染料稀释或ALDH活性),看FN14在DTP vs. bulk细胞中的表达差异,就能把机制更精确地定位到DTP上。
局限
回复实验缺失:没有做FN14过表达来"挽救"敲低表型,因果链条的最后一步是"关联"而非"充分证明"。 RH30细胞响应弱于RD:文中多次提到FN14敲低在RH30(腺泡型)中的效应不如RD(胚胎型)明显,但没有深入探讨亚型差异的机制。可能涉及PAX3/7-FOXO1融合蛋白的干扰,文中未展开。 体内逃逸机制未解析:诱导敲低后第4周肿瘤恢复生长,文中归因于"代偿通路",但没有测序或磷酸化蛋白组学数据来指明是哪条通路。 TWEAK-FN14结合的化学抑制剂L524-0366只测了增殖和克隆形成,没有测代谢——既然TWEAK刺激能影响OCR,那用抑制剂是否也能逆转TWEAK引起的代谢变化?文中没做,逻辑上有点不对称。
来源
期刊:Cancer Letters,2026。DOI: 10.1016/j.canlet.2026.218768