一句话亮点
今天这篇Cell Death & Differentiation的文章揭示了:KMT2D缺失通过重塑染色质景观,驱动肺腺癌向鳞状细胞癌转变,同时意外地让肿瘤对AURKA抑制剂变得格外敏感。
背景/痛点
第三代EGFR靶向药(如奥希替尼)已经大大改善了EGFR突变肺癌患者的预后。但靶向药耐药依然是临床上的棘手问题。很多患者耐药后,肿瘤病理类型从腺癌转变成鳞癌——这个现象就叫腺-鳞癌转变。
这意味着:肿瘤不是简单地获得了新的基因突变,而是换了个活法——从依赖某个癌基因,变成依赖另一种细胞身份存活。你继续给原来的靶向药,它不吃这套了。
那么,谁来主导这个"身份切换"?肿瘤怎么就从一种细胞类型变成另一种了?之前的研究找到了一些线索,比如LKB1缺失可以促进腺-鳞转变。但调控这个过程的表观遗传开关到底是什么,大家心里没底。
这篇文章瞄准的就是这个问题。
推理链分步拆解
第一步:大范围筛,锚定KMT2D
作者来了一个多组学交叉筛选。他们把四组数据放在一起取交集:1)对吉非替尼/奥希替尼耐药的细胞;2)鳞癌相关基因表达高的细胞;3)CCLE细胞系里跟鳞癌打分负相关的表观因子;4)TCGA病人样本里跟鳞癌打分负相关的表观因子。
六根"红线"汇成一股,其中就有KMT2D。

Fig. 1. KMT2D low expression is associated with tyrosine kinase inhibitor (TKI) resistance and squamous phenotype transition. A Venn diagram showing the intersection of four datasets: genes negatively correlated with osimertinib IC50 (blue, n = 79, P < 0.05), gefitinib IC50 (red, n = 69, P < 0.05), genes negatively correlated with ssGSEA-derived squamous signature scores in CCLE lung cancer cell lines (green, n = 586, P < 0.05), and negatively correlated with ssGSEA-derived squamous signature scores in TCGA LUAD and LUSC tumors (yellow, n = 331, P < 0.05). A total of six genes, including KMT2D, were commonly identified across all datasets. B Pearson correlation between KMT2D protein expression and osimertinib IC50 in 35 NSCLC cell lines (r = −0.4245, P < 0.0110). C Left: Correlation analysis between KMT2D mRNA expression and the ssGSEA squamous signature score in CCLE NSCLC cell lines (n = 172, r = −0.4488, P < 0.0001). Right: Correlation analysis between KMT2D mRNA expression and the ssGSEA squamous signature score in TCGA lung cancer samples (n = 965; LUAD and LUSC; r = −0.1181, P < 0.0002). D Heatmap showing RNA-seq analysis of gene expression changes in xenograft tumors from mice treated with vehicle control or osimertinib (5 mg/kg) for 2 weeks (datasets from GSE165019). E Heatmap illustrating RNA-seq-based analysis of gene expression profiles from patient tumor samples collected pre- and post-treatment with EGFR tyrosine kinase inhibitors (TKIs). Each row represents a patient sample pair, and genes highlighted in red denote key squamous markers significantly altered following EGFR-TKI treatment (datasets from GSE165019). F Representative immunohistochemistry (IHC) images of xenograft tumors derived from PC9 parental (Par.) and osimertinib- resistant (OR) cells stained for KMT2D, p63, and SOX2. Scale bar, 100 µm. Right: Quantification of marker expression (n = 4). Two-tailed unpaired t-tests, P < 0.01, P < 0.001. G Representative immunostaining of indicated proteins in two paired human EGFR-mutant lung cancer specimens experiencing squamous transition after EGFR TKI failure (pre-1st biopsy vs. post-transition 2nd biopsy). Scale bar, 50 µm. H Violin plots showing the expression of squamous-associated genes in NSCLC cell lines from the CCLE, stratified by KMT2D mutation status (wild-type versus mutant). Two tailed t-test for Mut vs WT per gene (P < 0.05, P < 0.01, P < 0.001). I Kaplan–Meier survival curves were generated to assess the relationship between KMT2D and TP63 expression levels and the overall survival probability in lung cancer patients.(图注取自PDF文本层,来源:Cell Death & Differentiation, 2026)
KMT2D是什么?组蛋白甲基转移酶,专门负责给H3K4加上一个甲基(H3K4me1),这个标记跟增强子激活密切相关。
@方法论点评:先筛表型相关,再筛耐药相关,层层取交集——这个思路保证了候选基因"既跟谱系转变有关,又跟临床耐药有关",不是单纯的相关性。
他们又回看TCGA数据发现:KMT2D低表达的病人预后更差,而鳞癌标志物(TP63、SOX2、KRT5)高表达也跟不良预后相关。这就提示KMT2D可能是一个"拦着鳞癌发生"的角色。
第二步:敲除验证——确实能"改头换面"
那好,既然相关,直接敲掉看看会发生什么。他们在EGFR突变的肺癌细胞里敲低了KMT2D。
结果很有意思:敲掉之后,腺癌的标记物(如NKX2-1、FOXA1/2)下去了,鳞癌的标记物(ΔNp63、SOX2、KRT5/6)上来了,Ki67也提高了。
更重要的是:敲除KMT2D后,细胞对奥希替尼的IC50明显升高。这就把KMT2D缺失、鳞癌转变、TKI耐药三者串起来了——不是各自独立的现象,而是同一个过程的不同侧面。

Fig. 2. KMT2D deficiency drives lung adenocarcinoma to a squamous transition through epigenetic chromatin rewiring. A ATAC-seq analysis of differentially accessible chromatin in WT (shControl) and KMT2D (shKMT2D) deficient cells. Heatmap showing ATAC-seq signal intensity in a 3 kb region centered on TSS. B Motif enrichment analysis of ATAC-seq peaks in KMT2D knockdown versus control cells. Log P- value: Statistical significance of motif enrichment (log-transformed). C BioPlanet integrates pathway analysis of genes corresponding to up- regulated differential peaks identified by ATAC-seq in KMT2D knockdown versus control groups. D Integrative Genomics Viewer (IGV) tracks of ATAC-seq showing the normalized peak scale (vertical axis) of adenocarcinoma and squamous lineage related genes derived from Control and KMT2D knockdown group. E Heatmap of ADC- and SCC-related genes from RNA-seq analysis in shControl and shKMT2D cells. Expression values represented as Z score of Log2-transformed TPM. F Representative immunofluorescence staining of the ΔNp63 in shControl and KMT2D knockdown cells. Blue: DAPI (nuclei); Red: ΔNp63. Scale bar, 20 µm. G, H Representative IHC for KMT2D, NKX2-1, p63, and KRT5/6 in xenograft tumors with EGFR L858R/T790M or KRASG12C mutations (n = 5 tumors/group; 5–10 random HPFs per tumor averaged). Scale bar, 100 µm. Quantification shows the percentage of positive cells, data are mean ± SD with individual tumors overlaid. Group differences (shControl vs shKMT2D) were tested by unpaired two-tailed t-test, P < 0.01, P < 0.001. I, J Dose-response curves and IC₅₀ analysis of osimertinib or almonertinib treatment in H1975 cells transduced with either sgControl or sgKMT2D. Data are presented as mean ± SD from three independent experiments. Statistical significance was determined using unpaired two-tailed t-test, P < 0.01.(图注取自PDF文本层,来源:Cell Death & Differentiation, 2026)
@方法论点评:敲除之后同时测转录组和染色质开放性(ATAC-seq)——这是个好习惯,既看到"结果"(mRNA变了),也看到"原因"(染色质状态变了),相当于把一张照片拍清楚了,还把底片也看了。
第三步:染色质发生了啥?——“锁"打开了
ATAC-seq显示,敲掉KMT2D后,全基因组染色质开放性发生了重排。具体来说:跟腺癌相关的基因(SFTPA1、FOXA1)的染色质开放性变差了,跟鳞癌相关的基因(ΔNp63、KRT6A)的染色质开放性变好了。
更有意思的是基序分析——开放程度增加的区域,富集的全是鳞癌的转录因子结合基序,比如p63和SOX2;而开放程度减少的区域,富集的是腺癌特异的基序,如FOXA1/2、NKX2-1。
这就像什么呢?原本腺癌的"锁”(染色质)锁住了鳞癌基因,不让它们表达。KMT2D一丢,锁被打开了,鳞癌的转录因子就能跑进去,启动一套全新的表达程序。
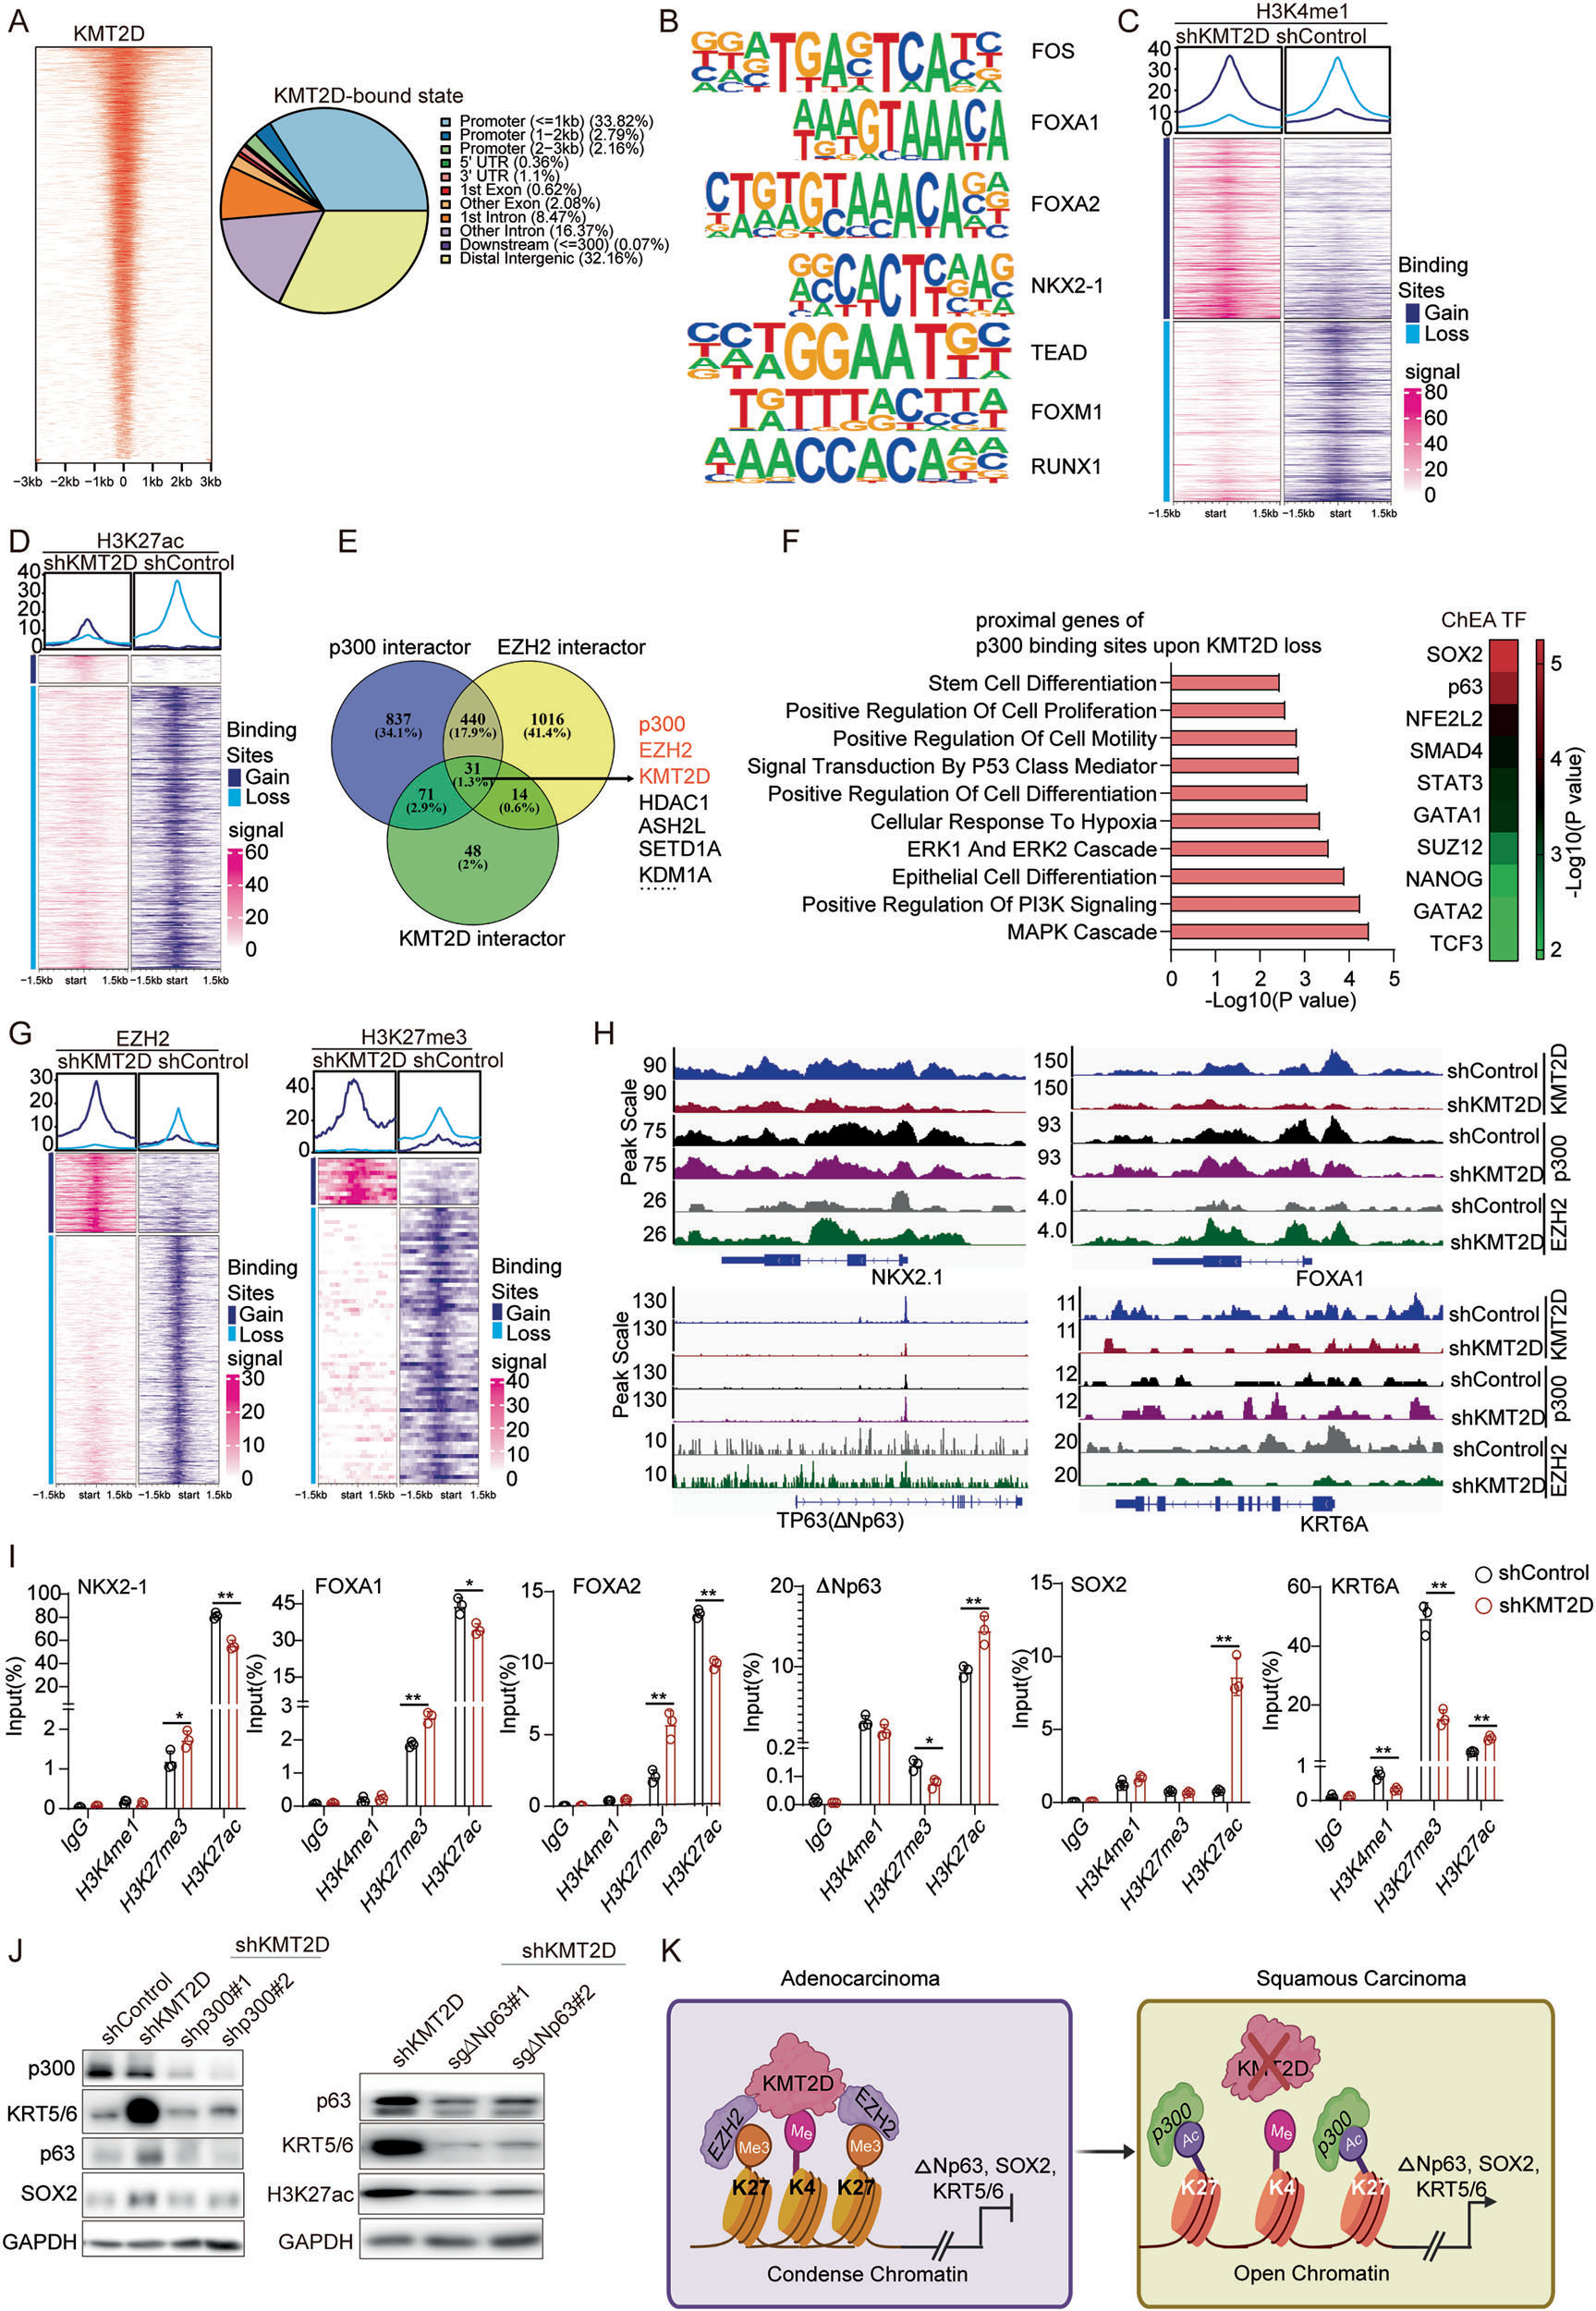
Fig. 3. Loss of KMT2D interrupts the epigenetic crosstalk required to maintain lineage fidelity. A Genome-wide KMT2D occupancy. Left: Heatmap of normalized KMT2D signal centered on peak summits (±3 kb), peaks ranked by intensity. Right: Genomic annotation of KMT2D peaks. B De novo motif analysis at KMT2D, H3K4me1, and H3K27ac binding sites identified significant enrichment for motifs of AP-1 (FOS), FOXA1, FOXA2, NKX2-1, TEAD, FOXM1, and RUNX1. C, D Heatmaps and average profiles of H3K4me1 and H3K27ac signal in shKMT2D versus shControl cells centered on the analyzed genomic regions (±1.5 kb). E Venn diagram showing the overlap among p300, EZH2, and KMT2D interacting proteins from BioGRID. Numbers indicate interactor counts in each category; percentages are relative to the total interactome set. F Bar plot (left) showing enriched Gene Ontology (GO) terms among genes proximal to p300 peaks after KMT2D depletion. Heatmap (right) displays ChEA transcription-factor enrichment, colors indicate −log10(P). G Heatmaps and average profiles of EZH2 and H3K27me3 signal in shKMT2D and shControl cells centered on the analyzed regions (±1.5 kb). H IGV showing normalized CUT&Tag signal for KMT2D, p300, and EZH2 across promoter and enhancer regions of adenocarcinoma-associated genes (NKX2-1, FOXA1) and squamous-associated genes (ΔNp63, KRT6A). I ChIP-PCR analysis of enrichment of H3K4me1, H3K27me3, and H3K27ac at the NKX2-1, FOXA1, FOXA2, ΔNp63, SOX2, and KRT6A promoter or enhancer, expressed as % input. Data are presented as mean ± SD (n = 3). Group differences were assessed by multiple unpaired two-tailed t-tests (one comparison per mark/locus). IgG serves as the negative control. P < 0.05; P < 0.01. J Western blot analysis of squamous lineage markers in KMT2D-deficient cells following p300 knockdown or ΔNp63 depletion. K Model of KMT2D-dependent regulation of lineage-specific chromatin states in NSCLC via EZH2 or p300 (Created with BioRender.com).(图注取自PDF文本层,来源:Cell Death & Differentiation, 2026)
@方法论点评:ATAC-seq看的是全基因组"哪些地方染色质打开了",但还需要进一步定位KMT2D直接结合的区域。他们后面用了CUT&Tag,这在技术上比传统ChIP-seq信噪比更高,适合少量细胞。
第四步:分子机制——一个精巧的跷跷板
那么KMT2D具体是怎么干的?他们发现KMT2D缺失会影响一个精巧的表观调控平衡:
在正常细胞里,KMT2D在腺癌谱系基因的增强子区域驻留,维持H3K4me1和H3K27ac的平衡,让腺癌基因正常表达。 另一方面,KMT2D与EZH2(PRC2复合物的催化亚基)有物理上的相互作用,帮助维持鳞癌基因区域的H3K27me3抑制性标记。 KMT2D一丢,鳞癌基因区域的H3K27me3减少,p300趁虚而入,把H3K27变成乙酰化——抑制变激活,鳞癌基因就这么被打开了。
这种KMT2D/p300/EZH2的三方博弈,决定了腺癌和鳞癌基因谁占上风。KMT2D缺失就像一个失衡的支点,让平衡倾向了鳞癌。
第五步:依赖图谱——CRISPR筛出"阿喀琉斯之踵"
KMT2D缺失让肿瘤改头换面,但同时是不是也带来了新的弱点?为了找出这个"七寸",他们用CRISPR-Cas9做了个激酶组全敲除筛选。
结果AURKA排在最前面——敲掉KMT2D的细胞,一旦再敲掉AURKA,活都活不下去。

Fig. 4. Kinome-wide CRISPR-Cas9 knockout screens revealed AURKA as a therapeutic target for KMT2D deficient lung cancer. A Experimental flow chart showing kinome-wide CRISPR-Cas9 knockout screening in KMT2D deficient cells (Created with BioRender.com). B β scores for gene essentiality were calculated following 7-day or 14-day screening periods. C The normalized counts of sgRNA targeting AURKA in day 0, day 7, and day 14 in KMT2D deficient lung cancer cells. D Scatter plots showing the correlation between KMT2D protein expression and alisertib sensitivity in non-small cell lung cancer (NSCLC). Data were analyzed based on different datasets from DepMap Portal. X-axis indicates the relative expression level of the protein. Y-axis indicates the log2 (fold change) and AUC (Area Under the Curve) value of the inhibitors. E Scatterplots indicate the effect size of the inhibitors from drug-screening analysis. Green indicates AURKA inhibitors, which are the most effective inhibitors in KMT2D-mutant cancer cells. Data from the GDSC1 and GDSC2 (Genomics of Drug Sensitivity in Cancer project phase 1 and phase 2). F Scatterplots show the effect size of AURKA inhibitors (Alisertib, CD532, and VX-680) across various pan-cancer cell lines with specific genomic mutations. Green dots represent the effect size in cell lines with KMT2D mutations. Data are sourced from the GDSC1 (Genomics of Drug Sensitivity in Cancer project, Phase 1). G Heatmap depicting the differential sensitivity of non-small cell lung cancer (NSCLC) to various drugs, stratified by KMT2D mutation status. Drug sensitivity is represented as a color gradient, where red indicates low sensitivity (higher IC50 or lower drug efficacy) and blue indicates higher sensitivity (lower IC50 or high drug efficacy). H Flowchart showing CRISPR KO-based dropout screening in DMSO and AURKA inhibitors (alisertib and VIC-1911) treated-cells (Created with BioRender.com). Rank plot showing the distribution of β scores of the genes were identified as essential in AURKA inhibitor treatment group. I Dose-response curves illustrating the effect of AURKA inhibitors (Alisertib, VIC1911 and AK-01) on cell viability in KMT2D-high and KMT2D-low expression lung cell lines. J Dose-response curves illustrating the effect of AURKA inhibitors (alisertib, VIC-1911, AK-01) on cell viability in KMT2D-high and KMT2D- low lung squamous cell lines. K Violin plots showing the distribution of IC50 values for alisertib in NSCLC with wild-type (WT) and mutant (Mut) KMT2D. Two-tailed unpaired t test. P < 0.01. IC₅₀ data were obtained from GDSC2, and KMT2D status was assigned based on CCLE lung cancer cell line annotations.(图注取自PDF文本层,来源:Cell Death & Differentiation, 2026)
@方法论点评:CRISPR筛选提供的是"功能必需性"的证据——不是相关,不是表达量变化,而是"没有这个东西你就不行"。这是比"表达有差异"更强的因果证据。
而且有意思的是,在公共数据库里,KMT2D突变的细胞对AURKA抑制剂(比如Alisertib、VIC-1911)更敏感。
第六步:机制深挖——KMT2D丢了,AURKA的"刹车"坏了
AURKA为什么会在KMT2D缺失的细胞里变得如此重要?作者把目光投向了蛋白稳定性。
WB一看,KMT2D敲掉后AURKA蛋白水平明显升高,但mRNA没怎么变——所以问题出在蛋白降解上。
进一步做放线菌酮(CHX)实验:正常细胞里AURKA一点点被降解,半衰期大概2.5小时左右;而KMT2D敲掉的细胞里,AURKA稳定地"悬"在那里,几乎不怎么降解。
怎么降解的?靠泛素化-蛋白酶体系统。他们发现E3泛素连接酶FBXW7正常时会跟AURKA结合,给它"盖上泛素的章"送去降解。但KMT2D缺失后,AURKA跟FBXW7的物理结合变少了,泛素化程度明显下降——AURKA就这么被"保"下来了,不用被降解。
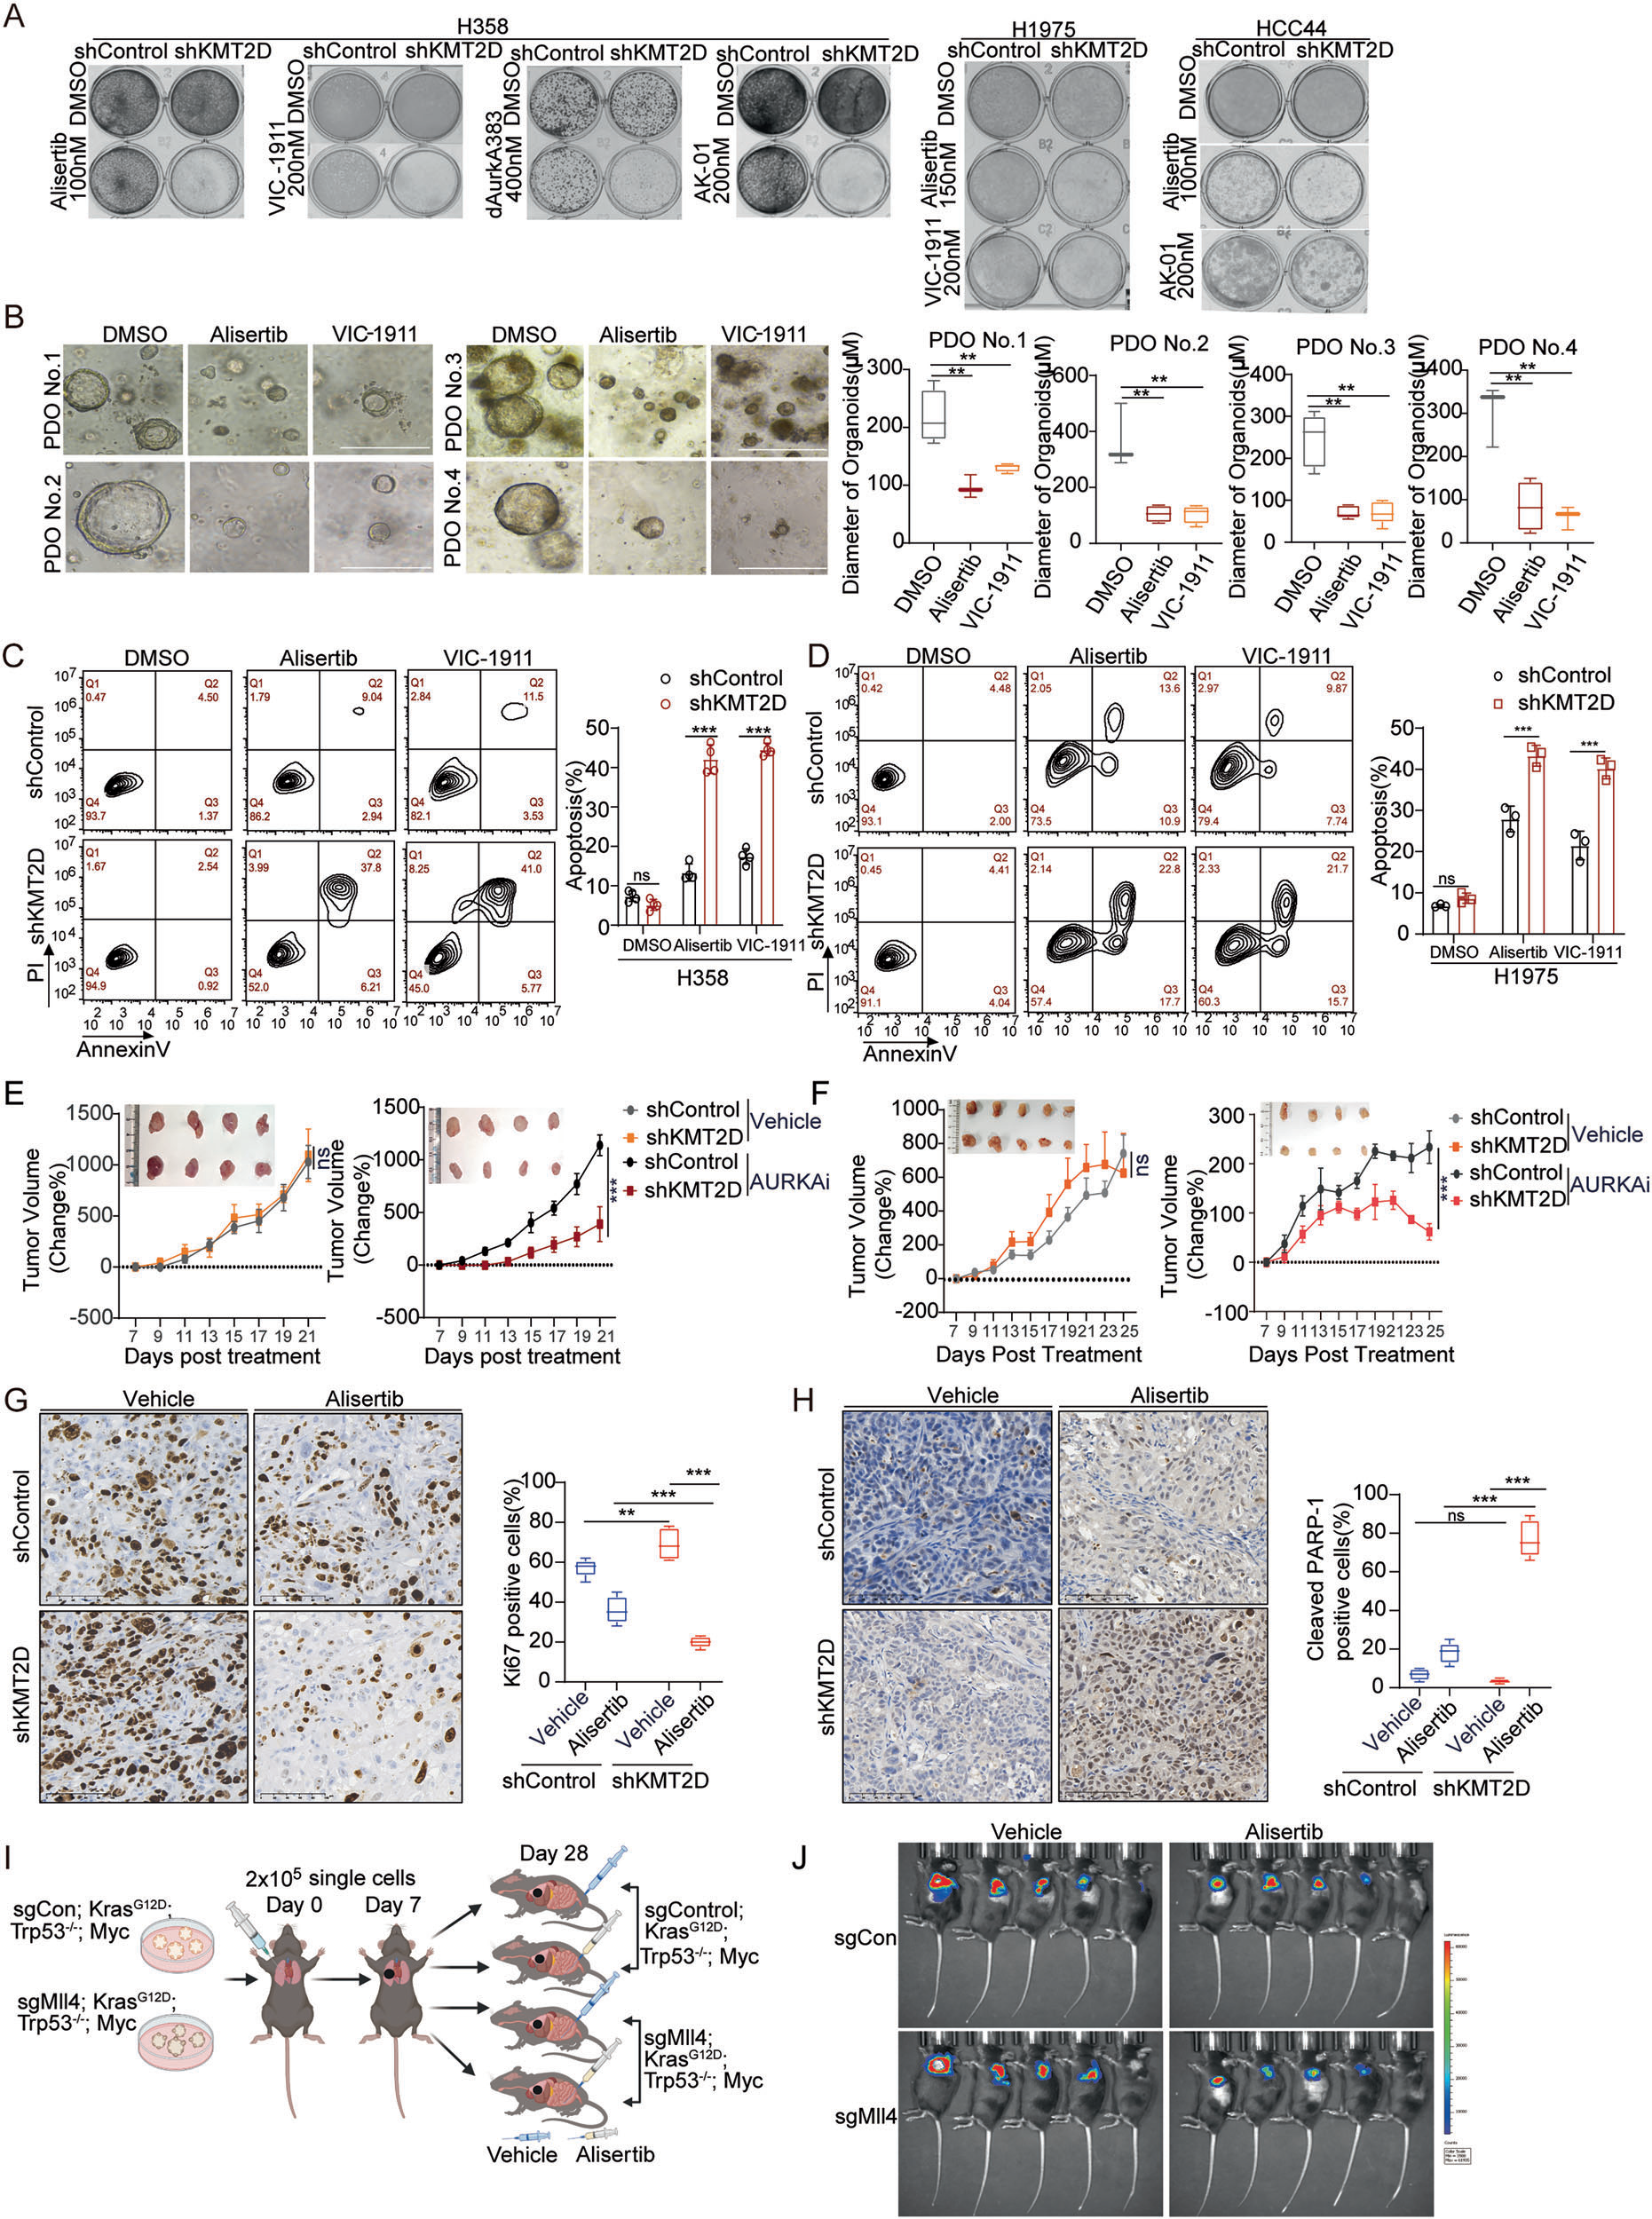
Fig. 5. KMT2D loss confers vulnerability to AURKA inhibition in vitro and in vivo. A Representative colony-formation images for NSCLC cells with shControl or shKMT2D under treatment with the indicated AURKA inhibitors. B Right: Representative images of patient-derived organoids (PDOs) after AURKA inhibitor treatment (Alisertib, VIC-1911). Scale bars, 500 μm. Left: Diameter quantification of PDOs under the indicated conditions (mean ± SD, n = 4 or 5). One-way ANOVA with Dunnett’s multiple-comparisons test versus DMSO. P < 0.01. C, D Apoptosis analysis of various NSCLC cells after AURKA inhibitor treatment. The cells in each group were stained with APC-conjugated Annexin V and PI and analyzed by flow cytometry. The numbers in box represents the cell proportion in each quadrant. The statical analysis were did in each group. Data shown as mean ± SD with individual points (n = 3 or 4). Two-way ANOVA. P < 0.001; ns not significant. E, F Normalized tumor volume for H1975 and H358 xenografts (shControl vs. shKMT2D) treated with vehicle or alisertib (30 mg/kg). Values are % change from treatment baseline; x-axis shows days on treatment. Data are mean ± SD (n = 4, 5 mice/group). Statistical comparisons were performed using two-way ANOVA. P < 0.001; ns not significant. G Left: Representative images show Ki67-positive nuclei (brown staining) in xenograft tumor sections derived from cells expressing either control shRNA (shControl) or shRNA targeting KMT2D (shKMT2D), treated with vehicle or the AURKA inhibitor alisertib. Scale bars: 100 µm. Right: The box plot (right) quantifies the percentage of Ki67-positive cells in each group (n = 4, 5; 5–10 random HPFs per tumor averaged). Two-way ANOVA test, P < 0.01, P < 0.001. H Left: Representative images of cleaved-PARP1 staining in xenograft tumor sections derived from cells expressing either control shRNA (shControl) or shRNA targeting KMT2D (shKMT2D), treated with vehicle or the AURKA inhibitor alisertib. Scale bars: 100 µm. Right: The box plot (right) quantifies the percentage of cleaved-PARP1-positive cells in each group (mean ± SD, n = 4, 5 tumors per group; 5–10 random HPFs per tumor averaged). Two-way ANOVA test, P < 0.01, P < 0.001; ns not significant. I Schematic overview of orthotopic mice model (Created with BioRender.com). J Representative IVIS Lumina images of KrasG12D; Trp53−/−; Myc mice with sgControl or sgMll4/Kmt2d tumors under vehicle or alisertib treatment (day 7–28). Color scale indicates radiance, identical exposure and scaling were used across groups.(图注取自PDF文本层,来源:Cell Death & Differentiation, 2026)
也就是说:KMT2D缺失 → AURKA-FBXW7结合减弱 → AURKA泛素化减少 → AURKA异常稳定累积。这是整条因果链的核心节点。

Fig. 6. KMT2D loss stabilizes AURKA through inhibiting FBXW7-mediated degradation. A Western blot analysis of H358 and H1975 cells with stable KMT2D knockdown (shKMT2D) or knockout (sgKMT2D), compared to corresponding control cells (shControl or sgControl). GAPDH served as a loading control. B Left: Western blot analysis of AURKA protein levels in H358 shControl and shKMT2D cells treated with cycloheximide (CHX, 50 μg/mL) for the indicated times (0–10 h). GAPDH was used as a loading control. Right: Quantification of AURKA protein levels over time, normalized to time 0. Quantification of AURKA protein levels over time, normalized to time 0. The half-life (t₁/₂) of AURKA was calculated using a one-phase decay model. C Left: Western blot analysis of AURKA levels in H358 shControl and shKMT2D cells treated with the proteasome inhibitor MG132 (10 µM) for the indicated durations (0–10 h). GAPDH served as a loading control. Right: Quantification of AURKA protein levels normalized to time 0. D Co-immunoprecipitation (Co-IP) was performed in H358 shControl and shKMT2D cells using an anti-AURKA antibody or IgG control, followed by immunoblotting for KMT2D, AURKA, and FBXW7. Input lysates and IgG pulldowns served as controls. GAPDH was used as a loading control. E Western blot analysis of AURKA, FBXW7, and KMT2D protein levels in H358 shControl and shKMT2D cells transduced with two independent shRNAs targeting FBXW7 (shFBXW7#1 and #2). Densitometric quantification of AURKA relative to GAPDH is shown below each lane. F shControl and shKMT2D cells were treated with MG132 and subjected to immunoprecipitation with anti-AURKA antibody. Immunoprecipitates were immunoblotted with P4D1 (anti-ubiquitin) to detect ubiquitinated AURKA. Whole-cell lysates (WCL) verified efficient KMT2D depletion in shKMT2D cells, GAPDH served as a loading control. G Schematic illustration the role of KMT2D in regulating AURKA stability (Created with BioRender.com).(图注取自PDF文本层,来源:Cell Death & Differentiation, 2026)
第七步:治疗窗口——AURKA抑制同时砍掉"鳞癌身份"和"增殖"
既然KMT2D缺失的细胞依赖AURKA活着,那给药抑制AURKA会怎么样?
他们用Alisertib处理KMT2D敲低的肿瘤,发现:
鳞癌标志物(p63、SOX2、KRT5/6)表达大幅下降 细胞凋亡增多、增殖下降 体内动物模型的肿瘤体积明显缩小
在更接近临床的PDX、患者来源类器官、免疫健全小鼠原位模型上,效果都得到了验证。
更关键的是:在奥希替尼耐药的细胞中,AURKA抑制剂+奥希替尼联合用药表现出明显的协同效应。这说明联合靶向AURKA和EGFR可能是一个克服耐药的策略。

Fig. 7. AURKA inhibition impairs squamous identity and overcomes TKI resistance in NSCLC. A Western blot analysis of squamous lineage- related protein expression in EGFR mutant (H1975) lung cancer cells, with and without KMT2D knockdown, following 72 h treatment with AURKA inhibitors. B Immunohistochemical (IHC) analysis of p63 (left panels) and Keratin 5/6 (right panels) expression in xenograft tumor sections derived from either control shRNA (shControl) or shRNA targeting KMT2D (shKMT2D) NSCLC cells with EGFR mutation (L858R +(图注取自PDF文本层,来源:Cell Death & Differentiation, 2026)
@方法论点评:他们用了四层模型验证——细胞、类器官、异种移植、免疫健全原位模型。每一层都增加了证据的生态效度,尤其是免疫健全原位模型,考虑了免疫微环境的影响,更接近临床真实情况。
核心结论
KMT2D缺失通过两条"手臂"驱动腺-鳞转变和耐药:
染色质层面:KMT2D缺失打破H3K4me1/H3K27ac/H3K27me3的表观平衡,让鳞癌转录因子(ΔNp63、SOX2)趁势激活鳞癌程序,同时关停腺癌程序。 蛋白稳定性层面:KMT2D缺失削弱AURKA与FBXW7的相互作用,AURKA泛素化降解受阻,异常累积。
这两条线汇合,使得KMT2D缺失的肿瘤既发生了身份切换(腺→鳞),又形成了对AURKA的异常依赖。AURKA抑制既能砍掉鳞癌身份,又能掐断增殖,一石二鸟。
对耐药/DTP/PGCC 的启示
这篇工作对理解TKI耐药和谱系可塑性有几点直接启发:
表观调控而非基因突变驱动谱系转变。KMT2D缺失不改变基因编码序列,只改变染色质状态,就能驱动完整的身份切换。这提示药物耐受持久细胞(DTP)的耐药状态,可能更多是表观层面的"决策变化"而非遗传层面的"不可逆损伤"。KMT2D的剂量敏感特性(单等位基因缺失即可引发变化)更强化了这个观点。 谱系转变是有"代价"的——带来新的治疗窗口。KMT2D缺失驱动鳞癌转变,却也让肿瘤对AURKA抑制剂变得脆弱。这跟PGCC的情形类似:多倍体巨细胞在应激下"退分化"获得生存优势,但同时可能暴露出新的代谢或分裂机制上的弱点。文中提到的"mitotic addiction"(有丝分裂依赖)也可能在PGCC中有重叠——尤其PGCC常表现出异常的中心体扩增和有丝分裂模式。 联合靶向表观驱动因子和下游效应分子的策略值得借鉴。KMT2D本身是组蛋白甲基转移酶,直接靶向它可能很难(广泛影响太多基因),但找到它驱动形成的"下游依赖"(AURKA),然后用已进入临床的AURKA抑制剂去处理——这是"通过合成致死应对谱系转变"的策略,对靶向DTP状态也有参考价值。
局限
文中也留下了一些有待回答的问题:
KMT2D突变在NSCLC中多数是单等位基因缺失,呈剂量敏感模式。但KMT2D表达降低到多少才触发转变?目前没有明确的阈值。文中用了shRNA敲低和sgRNA敲除两种模型,但还缺少一个精细的剂量梯度实验来划定这个"临界点"。 文中的KMT2D缺失是在癌细胞系里直接敲除/敲低,模拟的是肿瘤细胞自主的变化。但临床上谱系转变发生在TKI治疗压力下,涉及肿瘤微环境、免疫监视、基质细胞信号等外部压力。KMT2D缺失驱动鳞癌转变的"阈值"在体内是否受微环境影响?文中未充分探讨。 关于KMT2D-FBXW7-AURKA轴,文中证实的是"KMT2D缺失削弱AURKA-FBXW7结合",但KMT2D本身不是E3连接酶,它怎么促进两者的结合?是通过招募某个中间分子,还是通过染色质状态间接影响?文中未给出明确答案。 临床样本的验证主要来自回顾性队列和PDC/PDO模型,缺乏前瞻性的临床试验数据来确认KMT2D能否真正作为AURKA抑制剂疗效的预测标志物。
来源
期刊:Cell Death & Differentiation,2026年。DOI: 10.1038/s41418-025-01657-7