一句话亮点
巨噬细胞来源的IL1B通过IL1R1诱导成纤维细胞衰老,衰老的成纤维细胞通过分泌IL6和CXCL12制造“耐药微环境”,削弱化疗效果。
背景/痛点
化疗是结直肠癌治疗的基石,但耐药问题始终是临床痛点。肿瘤微环境,特别是癌症相关成纤维细胞,已被广泛认为是肿瘤进展和耐药的“帮凶”。
那么,CAF到底是怎么促进耐药的?作者注意到一个现象:CAF在肿瘤里会衰老。细胞衰老通常被看作是一种抑癌机制,但衰老的细胞会分泌大量的炎症因子、趋化因子和生长因子,这个现象叫衰老相关分泌表型(SASP)。SASP是一把双刃剑,它既能抑制肿瘤,也能在特定环境下促进肿瘤进展和耐药。
所以问题就来了:肿瘤微环境里到底有没有衰老的CAF?如果有,它们是不是通过SASP在暗中推动化疗耐药?作者就是从这个假设出发,设计了一整条推理链。
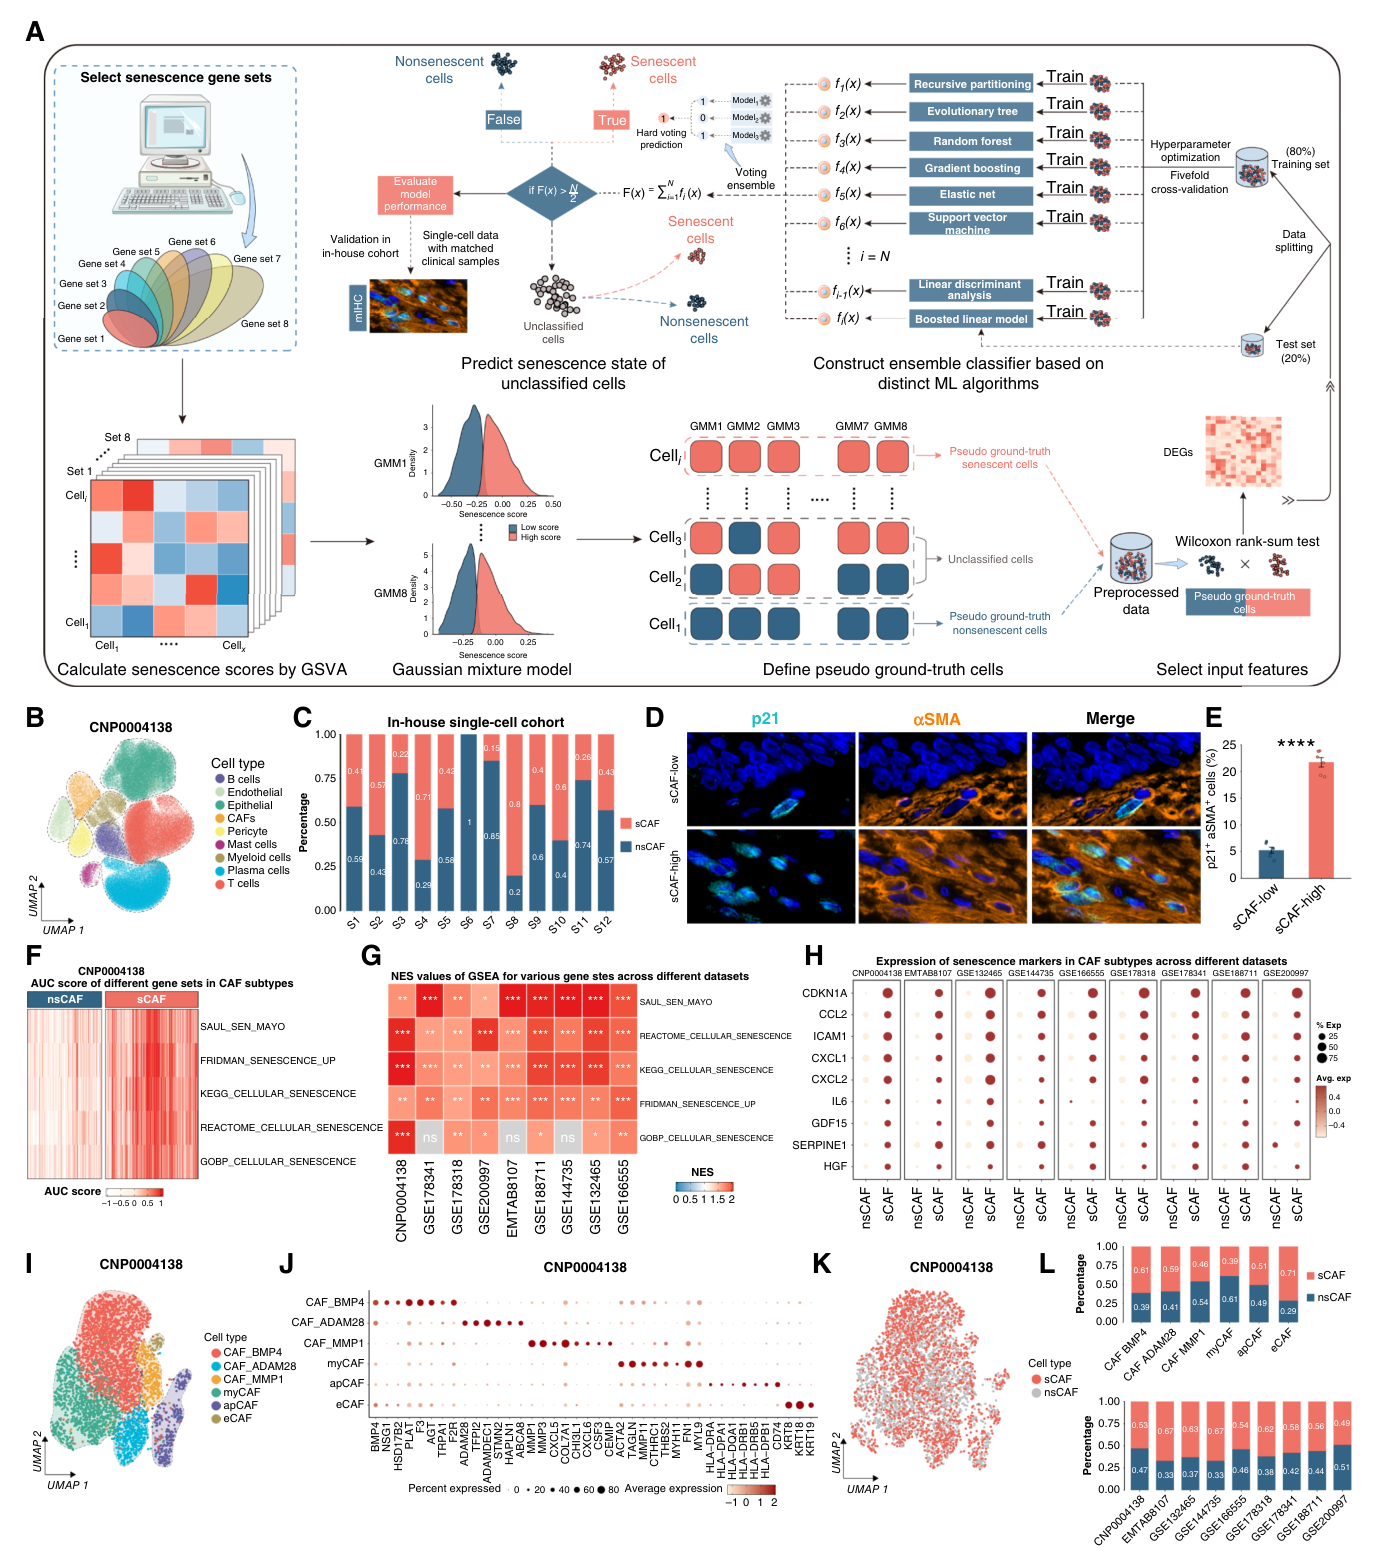
Fig. 1. Identifying sCAFs using a CSPM. A, Overview of the CSPM. B, Uniform Manifold Approximation and Projection for Dimension Reduction (UMAP) plot of the major cell types in the discovery cohort (CNP0004138). C, The senescence percentage of CAFs within each sample of the in-house cohort was calculated, and samples were classified as sCAF-high or sCAF-low according to the median value. D and E, Representative images and quantification of mIHC for sCAFs (p21+αSMA+ cells) in samples from the sCAF-high and sCAF-low groups. Data are mean ± SD. F, Heatmap displaying the AUCell scores of senescence gene sets across sCAFs and nsCAFs in the discovery cohort. G, Heatmap showing significant enrichment of senescence gene sets in sCAFs compared with nsCAFs across single-cell datasets, with color intensity reflecting the normalized enrichment score (NES) of GSEA. H, Dot plot comparing the expression of senescence markers across sCAFs and nsCAFs in(图注取自PDF文本层,来源:Cancer Research, 2026)
推理链分步拆解
第一步:先得找到“谁是衰老的CAF”
要研究一个东西,首先得能把它识别出来。但衰老细胞的鉴定一直是个老大难问题——传统marker如p16在转录组里表达极低,敏感性很差,单靠一两个标记根本抓不准。
作者在这里亮出了“组合拳”:他们开发了一个细胞衰老预测模型(CSPM),整合了12种机器学习算法,利用8个高斯混合模型生成“伪金标准”的衰老/非衰老标签,再基于差异基因训练集成分类器。
@方法论点评:这是一个典型的“弱监督学习”思路——用多个不完美的模型投票产生训练标签,再训练一个更强的分类器。这种策略在生物标志物发现中非常实用,特别是当金标准难以大规模获取时。
用这个模型,他们在多个单细胞数据集里把CAF分成了衰老CAF(sCAF)和非衰老CAF(nsCAF)。结果发现sCAF在多个CAF亚型中都有分布,并非某一亚型独有——提示衰老可能是CAF的一种“状态”而非一个固定的“亚型”。
第二步:sCAF和临床结局有关系吗?
找到sCAF后,作者立刻追问:这东西在患者里是不是真的跟耐药有关?
他们用两个层面来回答这个问题:转录组层面和蛋白层面。
在转录组层面,他们在GSE19860这个包含化疗响应信息的队列里做WGCNA,发现与化疗耐药高度相关的模块基因,其GSVA评分与sCAF特征评分呈显著负相关。进一步在多个bulk队列中验证,sCAF特征与化疗耐药签名正相关、与化疗敏感签名负相关。
在蛋白层面,他们在自家临床队列里用多重免疫组化(mIHC)直接在组织切片上数p21⁺αSMA⁺的双阳性细胞(即sCAF),发现化疗不响应组里sCAF的数量显著更高。
@方法论点评:这里体现了“从发现到验证”的闭环思维——先在bulk数据里看相关性,再用mIHC在组织切片上可视化验证。这两个方法相互补充,排除了单纯依赖转录组数据的批次效应和混杂因素。
生存分析也跟上来了:sCAF丰度高的患者,总生存期、无病生存期、无复发生存期都显著更差。
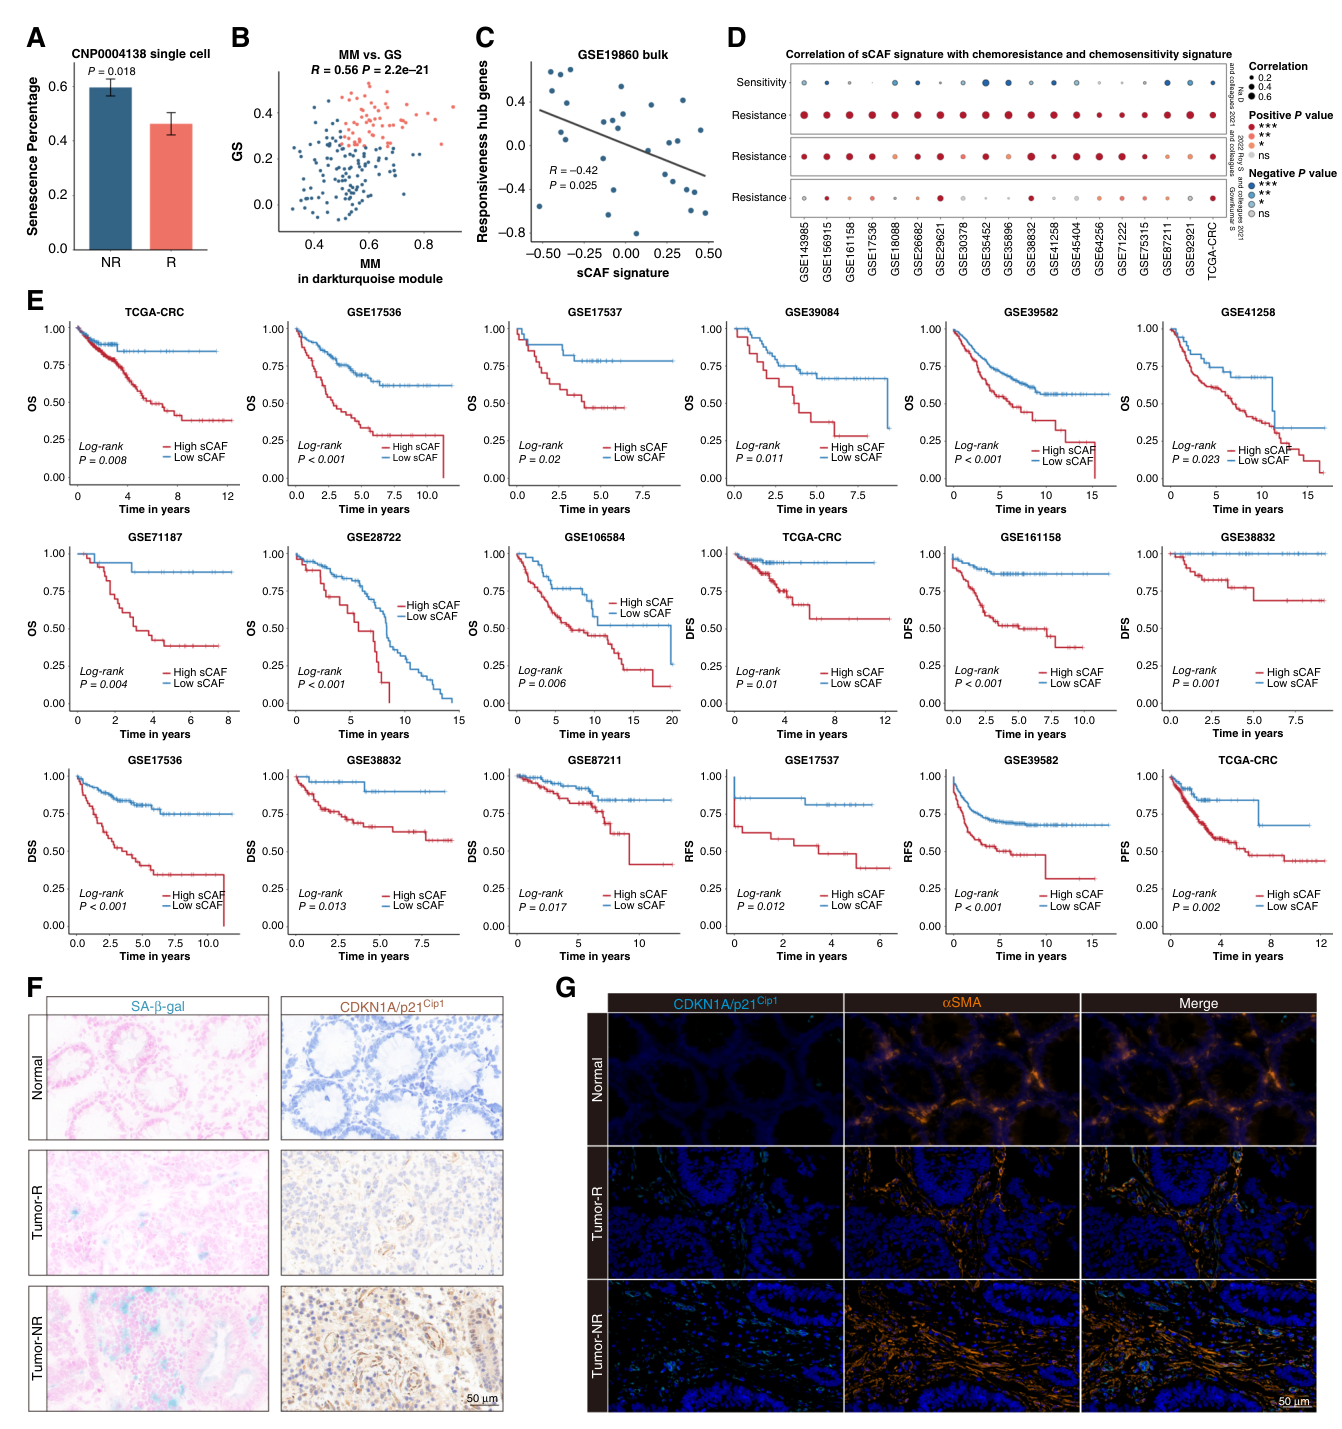
Fig. 2. sCAFs contribute to chemotherapy resistance and poor prognosis in colorectal cancer. A, Senescence percentage of CAFs across chemotherapy responsive (R) and nonresponsive (NR) samples in the discovery cohort. Data are mean ± SD. B, Scatterplot displaying the Pearson correlation between module membership (MM) and gene significance (GS) of genes in the darkturquoise module. Hub genes, highlighted in red, were selected based on the thresholds: MM > 0.5 and GS > 0.25. C, Correlation analysis showing a negative association between sCAF signature scores and hub gene scores calculated by GSVA in GSE19860. D, Dot plot showing the Pearson correlations of the sCAF signature with chemoresistance and chemosensitivity signatures. Dot color respectively represents positive correlation (red), negative correlation (blue), or no significant correlation (grey), whereas dot size reflects the absolute value of the correlation coefficient. E, Kaplan–Meier survival curves showing the association of higher sCAF abundance (calculated by CPM deconvolution) with poorer overall survival (OS), progression-free survival, disease-free survival (DFS), relapse-free survival (RFS), and disease-specific survival (DSS). F, Representative images of SA-β-gal staining (left) and IHC for p21 (right) on responsive (R; n ¼ 3) and nonresponsive (NR; n ¼ 3) colorectal cancer samples, as well as on normal tissue samples (n ¼ 3). G, mIHC for p21 and αSMA was performed on R (n ¼ 3) and NR (n ¼ 3) colorectal cancer samples and normal tissue samples (n ¼ 3). A. Statistical analysis was performed using two-tailed Wilcoxon rank-sum test; E, Statistical analysis was performed using the log-rank test. ns, not significant; , P < 0.05; , P < 0.01; , P < 0.001.(图注取自PDF文本层,来源:Cancer Research, 2026)
第三步:体内外验证——sCAF是真的“坏”,还是只是“围观群众”?
相关性不等于因果。为了证明sCAF是主动促进耐药,作者做了系统的功能实验。
他们先在体外诱导CAF衰老(博来霉素处理),然后收集这些sCAF的条件培养基,加到结直肠癌细胞里,再用FOLFOX处理。结果很清晰:加了sCAF条件培养基的癌细胞,增殖能力更强,凋亡更少——sCAF通过旁分泌给癌细胞穿上了“防弹衣”。
接下来是体内验证。他们做了好几套模型:
皮下移植瘤:把癌细胞和sCAF混在一起打进小鼠皮下 PDO(患者来源类器官)和PDOX(类器官异种移植) 原位瘤模型:直接把细胞打进盲肠壁,更贴近真实生理环境
在所有这些模型里,sCAF都显著削弱了FOLFOX的抑瘤效果。H&E、Ki67、TUNEL、caspase-3染色也一致地表明:sCAF共注射组的肿瘤更“恶性”、增殖更高、凋亡更少。
@方法论点评:这里的设计非常扎实——体外用条件培养基排除细胞间直接接触的影响,证明是旁分泌因子在起作用;体内用了四种模型(皮下、PDO、PDOX、原位)交叉验证,覆盖了从简化系统到复杂微环境的多个层级。特别是PDO和原位瘤模型,临床相关性强,证据链更完整。
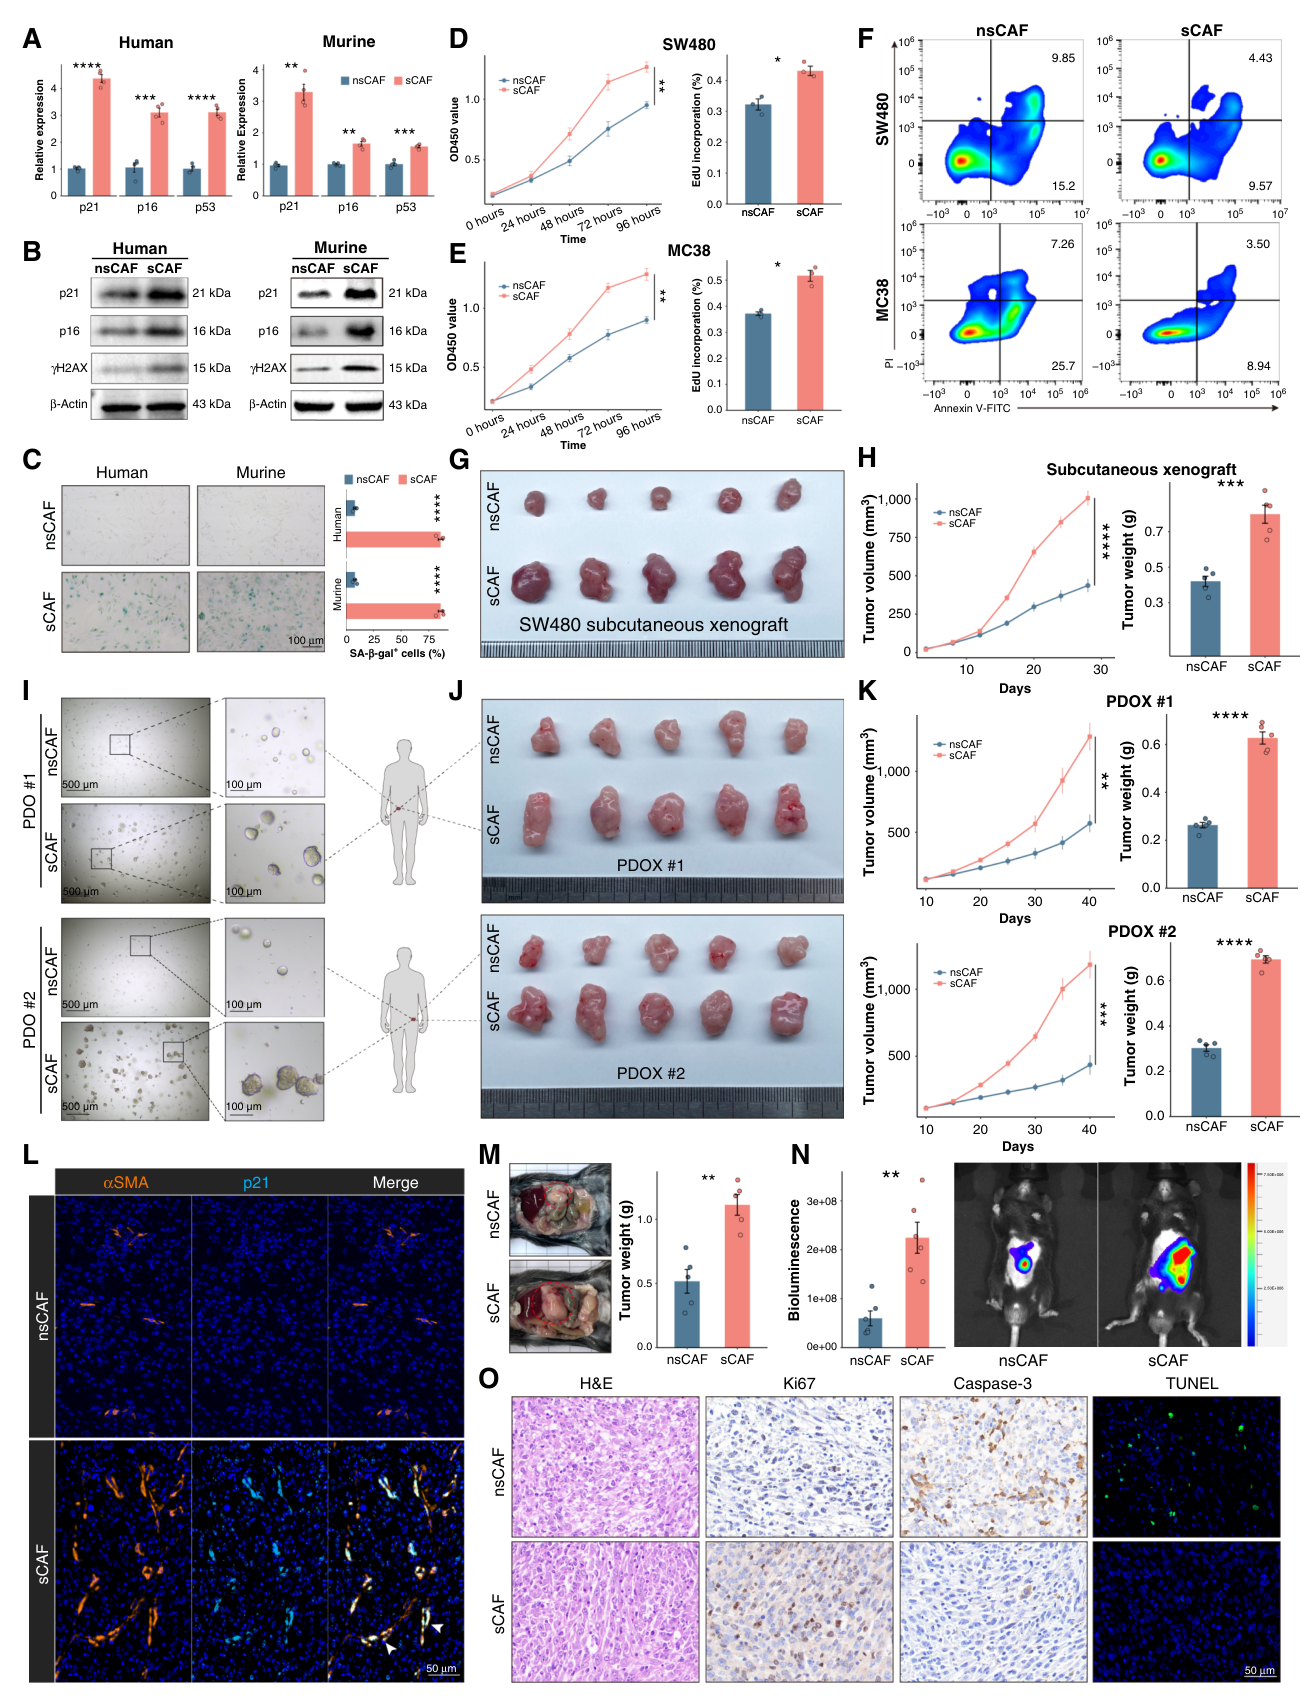
Fig. 3. In vitro and in vivo experiments demonstrate the chemoresistance-promoting role of sCAFs. A and B, qPCR (n ¼ 4 per group) and Western blot analyses of mRNA and protein levels for senescence markers in human and murine sCAFs and nsCAFs. C, Representative photographs of SA-β-gal staining and quanti- fication of SA-β-gal+ cells in human and murine sCAFs (n ¼ 3) and nsCAFs (n ¼ 3). D and E, CCK8 and EdU assays showing that CM from sCAFs significantly enhanced colorectal cancer cell proliferation (SW480, MC38) under FOLFOX treatment (n ¼ 3 per group). F, Flow cytometry analysis showing reduced apoptosis in colorectal cancer cells (SW480, MC38) treated with sCAF CM under FOLFOX treatment (n ¼ 3 per group). G, Representative images of subcutaneous xenografts from SW480 colorectal cancer cells coinjected with sCAFs (n ¼ 5) or nsCAFs (n ¼ 5) under FOLFOX treatment. H, Tumor growth curves and final tumor weights of subcutaneous xenografts. I, Organoid formation from PDOs cocultured with sCAFs (n ¼ 3) or nsCAFs (n ¼ 3) under FOLFOX treatment. J, Representative images of PDOXs cocultured with sCAFs (n ¼ 5) or nsCAFs (n ¼ 5) under FOLFOX treatment. K, Tumor volume growth curves and final weights from PDOX models. n ¼ 5 per group. L, mIHC for p21 and αSMA in orthotopic tumors, with tumor cells mixed with sCAFs or nsCAFs before injection. n ¼ 3 per group. M, Representative images and quantification of tumor weights from orthotopic tumor models under FOLFOX treatment. n ¼ 5 per group. N, Representative bioluminescence images and quantification of bioluminescence intensity for orthotopic tumor models under FOLFOX treatment. n ¼ 6 per group. O, H&E staining and IHC for orthotopic tumors under FOLFOX treatment. n ¼ 3 per group. Data are mean ± SD. Statistical analysis was performed using the two-tailed unpaired t test. ns, not significant; , P < 0.05; , P < 0.01; , P < 0.001; , P < 0.0001.(图注取自PDF文本层,来源:Cancer Research, 2026)
第四步:锁定SASP中的“关键因子”——IL6和CXCL12
sCAF分泌一大堆因子,到底谁是抗耐药的主力?作者用了一套筛选流程:
单细胞数据里对比sCAF和nsCAF,找出在发现队列和验证队列中一致上调的SASP因子; qPCR验证mRNA水平; 用细胞因子芯片筛蛋白水平; ELISA最终确认。
层层“海选”下来,IL6和CXCL12脱颖而出——它们在sCAF中mRNA和蛋白水平都显著升高。
接下来的功能验证是“闭环式”的:单独敲低IL6或CXCL12只能部分逆转sCAF的促耐药效应,但同时敲低两者则能几乎完全消除这种效应。用中和抗体阻断这两个因子也得到了同样的结果。
@方法论点评:单敲和双敲的对比设计非常关键——单敲只能部分恢复,说明IL6和CXCL12有功能冗余或协同作用;双敲完全恢复,说明这两个因子基本就是sCAF促耐药的主要效应分子。这种“叠加-消除”的逻辑是因果推断的经典策略。
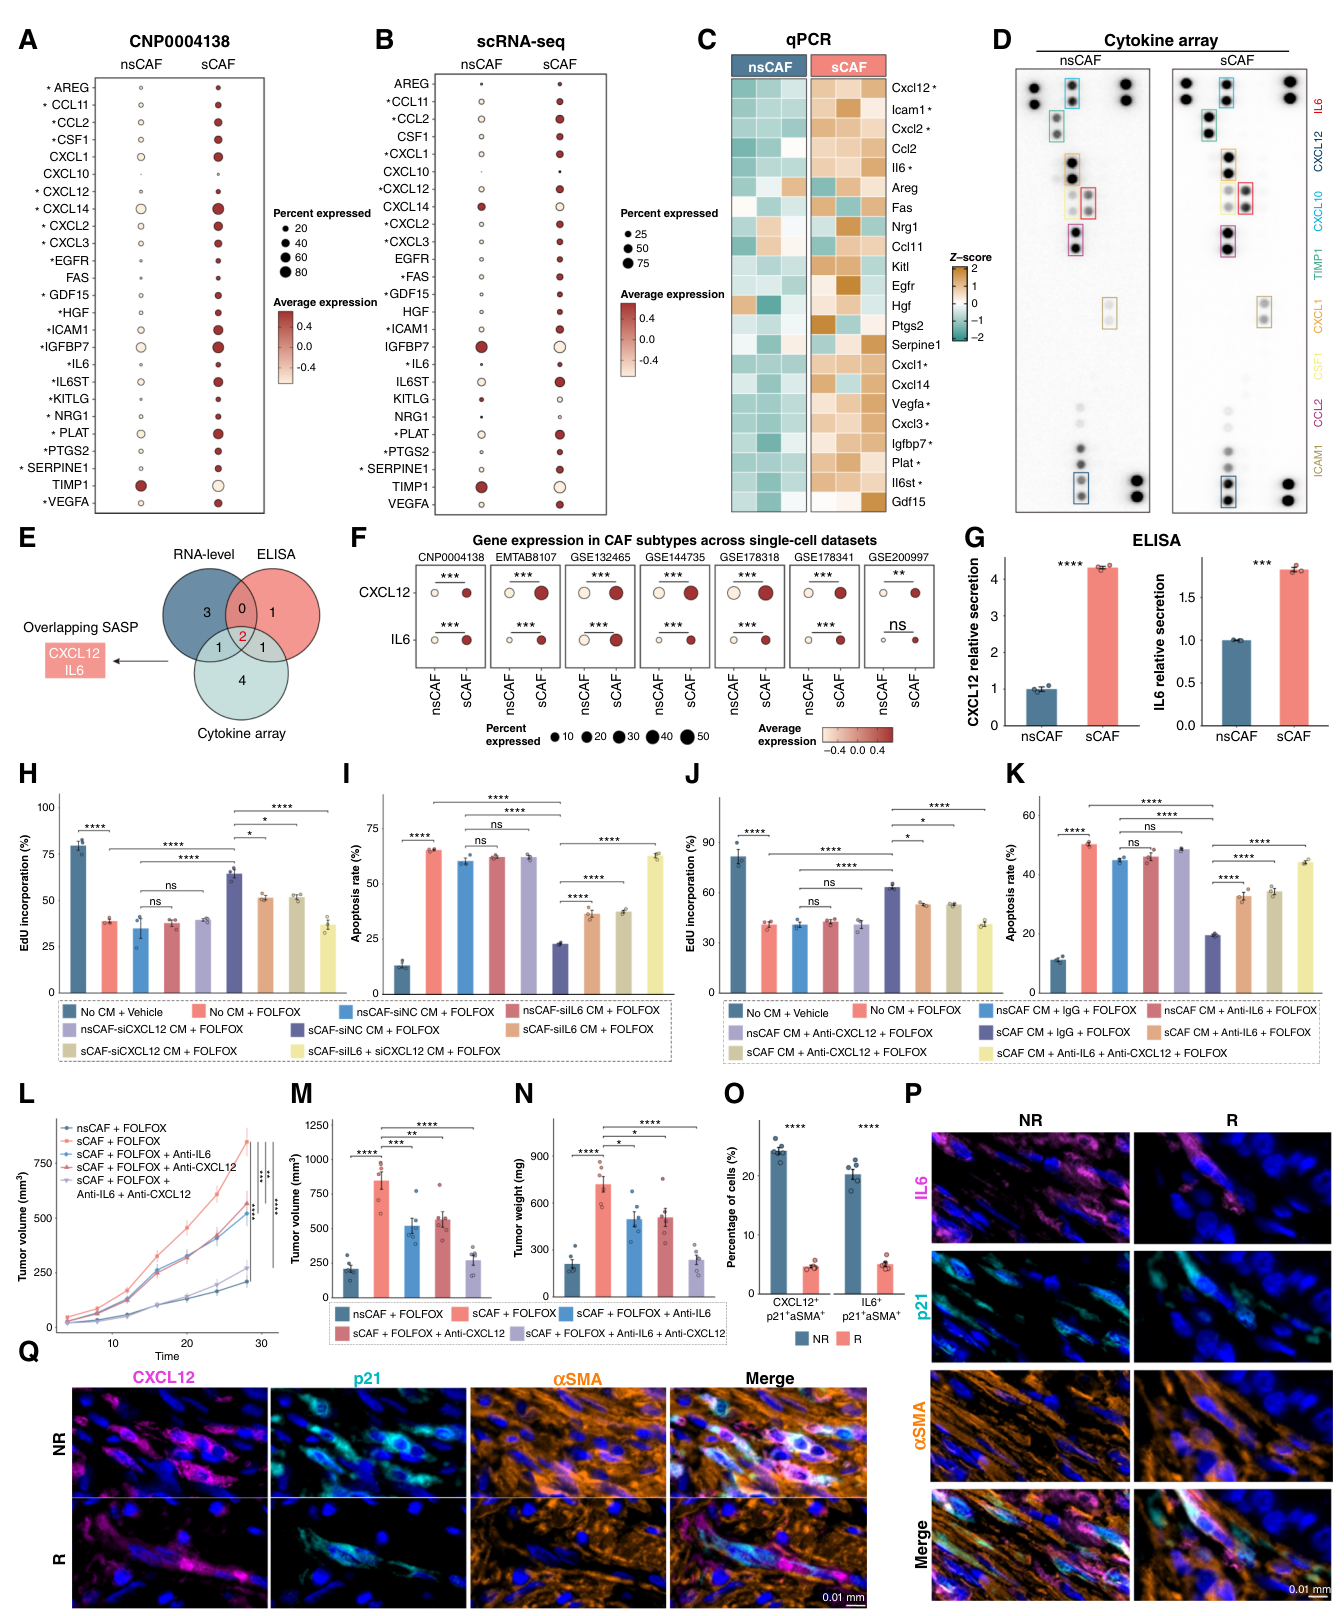
Fig. 4. sCAFs lead to chemotherapy resistance through the secretion of IL6 and CXCL12. A, Dot plot displaying higher expression levels of SASP components in sCAFs compared with nsCAFs in the discovery cohort. Genes expressed significantly higher in sCAFs are labeled with an asterisk (). B, Expression of SASP components in sCAFs and nsCAFs in the combined single-cell dataset comprising eight public validation cohorts. Genes expressed significantly higher in sCAFs are labeled(图注取自PDF文本层,来源:Cancer Research, 2026)
第五步:CAF是怎么变老的?——追根溯源到巨噬细胞
确定sCAF有害之后,作者把矛头转向了更上游的问题:谁在诱导CAF衰老?
他们用CellChat做细胞间通讯分析,发现sCAF和巨噬细胞的交互最强。进一步计算“通讯概率差”,发现在所有配体-受体对中,巨噬细胞的IL1B与CAF的IL1R1的差异最显著。
为了验证这个“上游调控”关系,他们用了三组实验:
重组的IL1B蛋白(rmIL1B)直接加到CAF里,能显著诱导CAF衰老; 如果在CAF里敲低IL1R1,rmIL1B就再也诱导不了衰老了; 用IL1B敲低的巨噬细胞的条件培养基处理CAF,同样失去了诱导衰老的能力。
@方法论点评:这三组实验构成了一个完整的“配体→受体→功能”因果链。第一步证明“够了”(配体足够诱导表型),第二步和第三步证明“缺了就不行”(受体或配体缺失后效应消失)。这是验证细胞-细胞通讯功能的金标准框架。

Fig. 5. Macrophage-derived IL1B induces CAF senescence through direct interaction with IL1R1. A, Network plot illustrating the cell–cell communication of sCAFs. mEpi, malignant epithelial cell; cDC, conventional dendritic cell; pDC, plasmacytoid dendritic cell; nEpi, normal epithelial cell. B, Dot plot depicting the CCI Prob Diff from other cell types to sCAFs relative to nsCAFs. Both dot size and color represent the CCI Prob Diff. C, Heatmap showing the expression of ligand–receptor genes from the crucial interactions between macrophages and sCAFs across cell subtypes. D, Heatmap (top left) depicting the activity of top-ranked ligands inferred to regulate sCAFs by macrophages, along with the prioritized interaction potential of each ligand–receptor pair, as predicted by NicheNet (color intensity reflects either ligand activity or interaction potential). Bar plot (top right) displays the prioritized interaction potential of top ligand–receptor pairs from macrophages to sCAFs. Heatmap (bottom) shows top-ranked ligands and their predicted downstream target genes in sCAFs. E, The spatial transcriptomics plots of macrophages (left) and sCAFs (middle) scored by the AddModuleScore function, and the correlation scatterplots (right) of signature scores between macrophages and sCAFs in each spot. F, M1/M2 signature scores in IL1B+ macrophages within the discovery cohort. G, Correlation analysis between IL1B expression and M1/M2 signature scores in the TCGA-CRC. H, ELISA quantification of IL1A and IL1B levels in the supernatants of M1 macrophage cultures (n ¼ 3 per group). Data are mean ± SD. I, Correlation analysis showing a positive association between IL1R1 expression and senescence scores in CAFs within the discovery cohort. J–M, Box plots showing the senescence scores across groups stratified by IL1B (J) and IL1R1 (L) expression in TCGA-CRC, with GSEA results revealing the enrichment of senescence gene sets in the high IL1B (K) and high IL1R1 (M) groups. NES, normalized enrichment score. N, Kaplan–Meier survival curves demonstrating that patients with higher IL1R1 expression correlate with worse survival. O, Spatial transcriptomics data depicting widespread IL1B– IL1R1 interactions in the colorectal cancer landscape. P, Images of mIHC for IL1B, CD86, IL1R1, and αSMA showing spatial proximity between IL1B+ macrophages (IL1B+CD86+ cells) and IL1R1+ CAFs (IL1R1+αSMA+ cells), particularly in chemotherapy nonresponsive samples of patients with colorectal cancer. n ¼ 6 per group. H, Statistical analysis was performed using two-tailed unpaired t tests; J–M, Statistical analysis was performed using Wilcoxon rank-sum test. ns, not significant; , P < 0.05; , P < 0.01; , P < 0.001; , P < 0.0001.(图注取自PDF文本层,来源:Cancer Research, 2026)
第六步:空间证据——在真实组织里“看到”它们挨在一起
上述结论都是在单细胞数据或体外实验中得到的,为了证明在真实的肿瘤组织里确实是IL1B⁺巨噬细胞和IL1R1⁺CAF在“对话”,作者用了空间转录组学数据:在空间切片上,巨噬细胞的signature评分和sCAF的signature评分在空间上显著正相关。
进一步用mIHC直接在组织切片上共染IL1B、CD86(M1巨噬细胞标记)、IL1R1和αSMA。可以看到在化疗不响应的患者样本中,IL1B⁺CD86⁺巨噬细胞与IL1R1⁺αSMA⁺CAF在空间上邻近——空间上的接近为分子层面的交互提供了最直观的证据。
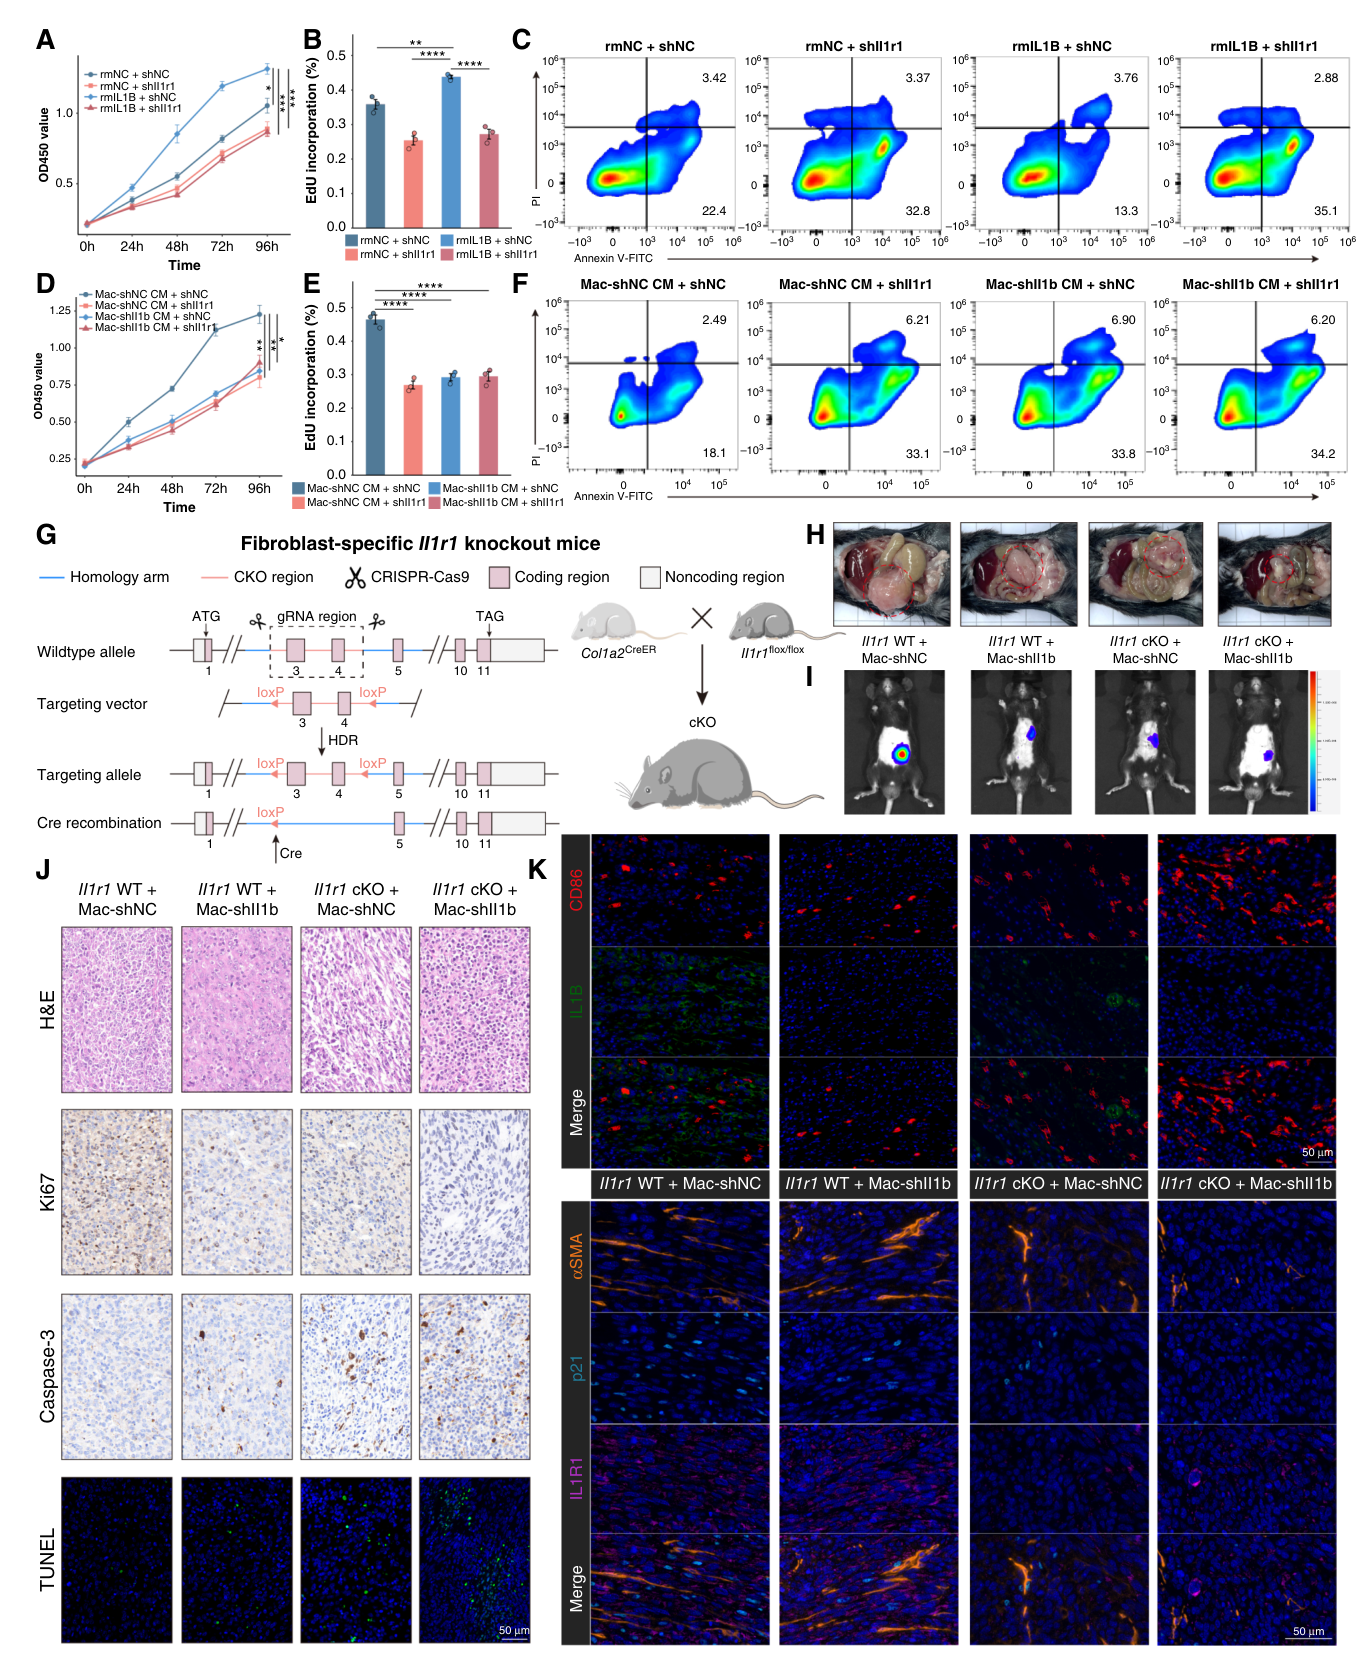
Fig. 7. IL1B–IL1R1 interaction between macrophages and CAFs leads to chemotherapy resistance in colorectal cancer. A–C, CCK8, EdU, and flow cytometry analyses of colorectal cancer cells (MC38) under FOLFOX treatment, treated with CM from control or IL1R1-knockdown CAFs, which were pretreated with or without rmIL1B(图注取自PDF文本层,来源:Cancer Research, 2026)
第七步:最后的闭环——成纤维细胞特异性IL1R1敲除小鼠
所有体外证据已经足够充分,但作者还想在最接近临床的场景里验证这条轴的因果关系。他们构建了成纤维细胞特异性IL1R1敲除小鼠(cKO)——只有成纤维细胞里的IL1R1被删除,其他细胞不受影响。
在原位瘤模型里,他们分别注射了对照巨噬细胞或IL1B敲低巨噬细胞,然后给FOLFOX化疗。结果非常清晰:
在野生型小鼠里,对照巨噬细胞组肿瘤最大——IL1B信号完整,CAF可以被诱导衰老,耐药最强; 在cKO小鼠里,即使注射对照巨噬细胞,肿瘤也比野生型小得多——CAF没有IL1R1,“接收不到”巨噬细胞的衰老信号,耐药效应被阻断; 在野生型小鼠里巨噬细胞IL1B被敲低,也得到类似的效果。
@方法论点评:这是全篇最具“定音锤”效应的实验。成纤维细胞特异性敲除直接证明了IL1R1这个受体在成纤维细胞上是IL1B诱导衰老和促耐药的必要前提。它排除了IL1B影响其他细胞类型间接产生效应的可能性——靶点清晰、逻辑严密。

Fig. 8. (图注取自PDF文本层,来源:Cancer Research, 2026)
核心结论
作者画出了一条清晰的因果链:
M1型巨噬细胞分泌IL1B → IL1B与CAF上的IL1R1结合 → 诱导CAF进入衰老状态 → 衰老CAF通过SASP分泌大量IL6和CXCL12 → 旁分泌作用于癌细胞 → 癌细胞获得对FOLFOX化疗的抵抗能力
这条链的每一个环节——从上游配体、受体,到下游效应分子,再到最终的功能表型——都有实验证据支撑,形成了完整的因果闭环。
对耐药/DTP/PGCC 的启示
耐药微环境的“非肿瘤细胞”来源:传统耐药研究多聚焦于肿瘤细胞自身的基因突变或表型转换(如DTP、PGCC),本研究提醒我们——微环境中的基质细胞衰老状态本身就是耐药的重要驱动因素。在分析耐药机制时,不能只看癌细胞,还要关注其“邻居”的衰老状态。 SASP因子作为耐药干预靶点:IL6和CXCL12被确定为sCAF促耐药的主要效应因子,且双敲才能完全阻断效应。这提示在临床上,同时靶向多个SASP因子可能比单一阻断更有效。对于DTP细胞而言,IL6和CXCL12可能是其维持“可逆休眠”状态的外部支撑信号。 IL1B-IL1R1轴作为“上游刹车”:与其在下游堵IL6和CXCL12,不如从上游阻止CAF衰老的发生。靶向IL1B或IL1R1可能不仅阻断当前耐药微环境的形成,还能预防新的sCAF积累,具有更好的预防性价值。对于PGCC而言,CAF衰老诱导的炎症微环境是否促进其形成和存活,值得进一步探索。
局限
化疗方案单一:所有体内外实验均使用FOLFOX方案(5-FU + 奥沙利铂),未验证该机制是否在其他化疗方案(如伊立替康、靶向药或免疫治疗)中也成立。 衰老的“状态”vs“亚型”争议未完全解决:虽然作者证明多个CAF亚型均可进入衰老状态,但未深入探讨不同来源CAF进入衰老后SASP谱是否存在差异,以及这种差异是否影响耐药强度。 IL1B来源的多样性:虽然聚焦于M1巨噬细胞来源的IL1B,但其他免疫细胞(如树突状细胞、T细胞)也可能分泌IL1B,其在体内的实际贡献未做定量比较。 临床转化距离:IL1R1靶向药物目前尚不成熟,成纤维细胞特异性敲除在小鼠可行,但临床靶向需要克服细胞特异性递送的难题。
来源
期刊:Cancer Research,2026。DOI: 10.1158/0008-5472.can-25-4870