一句话亮点
肿瘤EVPs不是直接破坏内皮,而是通过ITGa5重编程肺间质巨噬细胞(IMs),使其分泌IL-6,进而打开血管屏障,为癌细胞外渗和转移铺路。
背景/痛点
转移是癌症致死的最主要原因,而肿瘤细胞要成功定植远端器官,必须先从血管内"钻出去"——这个动作离不开血管通透性的增加。肺作为转移最常发生的器官之一,其血管渗漏更是预转移微环境(PMN)形成的核心特征。
此前学界已认识到肿瘤分泌的EVPs(细胞外囊泡和颗粒)能在24小时内诱导肺血管渗漏,但机制不清。主流观点认为EVPs可能直接作用于内皮细胞,破坏其紧密连接。但作者敏锐地发现了一个被忽略的问题:EVPs到底优先被谁吃了?他们决定从这个问题切入,重新审视血管渗漏的源头。
推理链分步拆解
第一步:肿瘤模型与EVPs诱导渗漏的差异
他们首先比较了四种肿瘤模型:肺转移能力强的B16F10(黑色素瘤)、K7M2(骨肉瘤)、4T1(乳腺癌),和非转移性的67NR。结果显示,原位荷瘤14天后,不同肿瘤诱导的肺血管渗漏程度差异显著——B16F10和K7M2最强,4T1中等,67NR最弱。关键在于,这种渗漏早在肿瘤体积还很小的时候(2天)就已出现,且不再随瘤体增大而加重。
更有趣的是,渗漏大多发生在vWF阳性的中大血管周围,而非毛细血管。这让作者意识到,EVPs可能不是通过常规的"毛细血管渗漏"模式,而是有更特定靶向的机制。
随后他们验证了EVPs本身的致渗漏能力:1小时内,B16F10和K7M2的EVPs就能重现荷瘤状态下的渗漏。而Rab27a敲除(EVP产生减少)的肿瘤渗漏显著下降,进一步确认了EVP是主要驱动者。
@方法论点评:这一步的关键在于选对对照——非转移性67NR和低渗漏4T1的存在,让"渗漏能力与转移能力相关但不完全一致"的结论更有说服力。同时,1小时这个时间窗的设计,为后续避开免疫细胞招募、ECM重构等混淆变量奠定了基础。
第二步:急性渗漏直接促进外渗和转移
“1小时就能渗漏,那这渗漏到底管不管用?“作者进行了因果验证:先注射不同EVPs,1小时后注射肿瘤细胞,14天后看转移灶。
结果很干脆:能诱导渗漏的EVPs(B16F10、K7M2),都能显著增加转移灶;不能渗漏的(Melan-A、4T1)则无效。更有意思的是,用K7M2 EVPs"教育"4T1细胞,原本渗漏弱、转移少的4T1转移灶明显增加。这说明渗漏能力是可传递的,是EVP赋予的"预备状态”。
3D全器官成像进一步证实,EVP处理使癌细胞外渗率显著提升。没有观察到多细胞灶比例的变化,说明不是增殖,而是渗漏本身在推动外渗和播种。
@方法论点评:这里用了双重因果检验——“功能获得”(低渗漏模型+高渗漏EVP=转移增加)和"功能缺失”(抑制EVP产生=渗漏下降),这是判断因果关系的黄金标准。组胺作为阳性对照,也提示我们他们考虑到了"渗漏是否只由EVP介导"的替代解释。
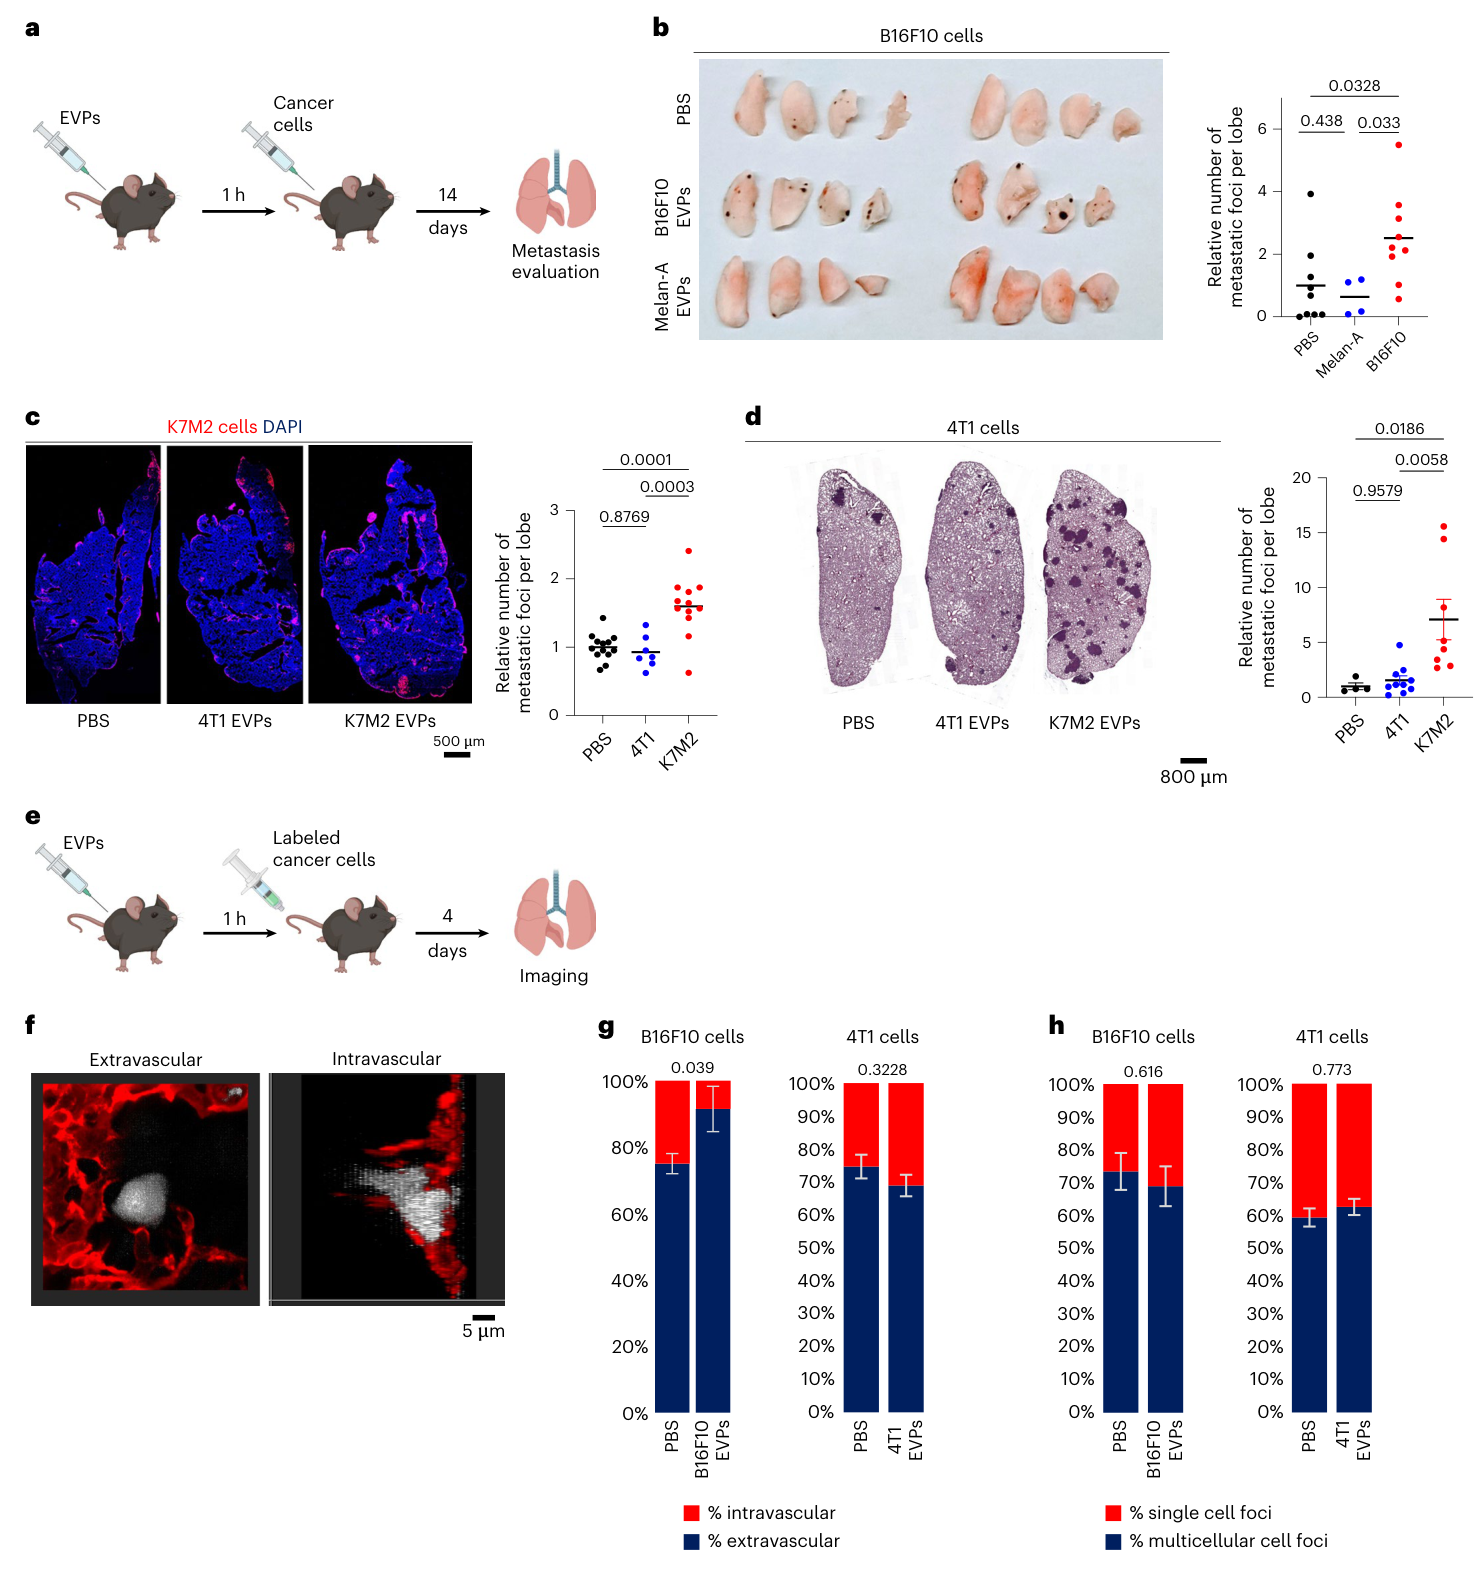
Fig. 2. Acute vascular leakiness promotes cancer cell extravasation and lung metastasis. a, Schematic illustration of the experiment. b, Representative images of mouse lungs at 2 weeks after tail-vein injection of 50,000 B16F10 cells (left) and associated statistical analysis (right) of relative number of macrometastases compared to PBS. Data represent the mean ± s.e.m., analyzed using a one-way ANOVA with Šídák’s multiple-comparison test. Data were derived from n = 9 mice per group for PBS and B16F10 and n = 4 mice for Melan-A across three independent experiments. c. Representative immunofluorescence imaging of lung lobe at 2 weeks after tail-vein injection with 300,000 K7M2 cells and associated statistical analysis of relative number of metastases compared to PBS. DAPI-stained nuclei appear in blue and K7M2 cells in red. Data represent the mean ± s.e.m., analyzed using a one-way ANOVA with Šídák’s multiple- comparison test. Data were derived from n = 13, 7 and 12 mice per group for PBS, 4T1 and K7M2, across three independent experiments. Scale bar, 500 µm. d, Representative H&E staining of lungs of mice after tail-vein injection with 50,000 4T1 cells for 14 days and associated statistical analysis for number of metastases. Data represent the mean ± s.e.m., analyzed using a one-way ANOVA,(图注取自PDF文本层,来源:Nature Cancer, 2026)
第三步:谁才是真正的"受器"?间质巨噬细胞浮出水面
那EVPs到底在肺里被谁吃了?1小时内的流式结果显示:60-70%的EVPs被CD45+免疫细胞摄入,CD31+内皮细胞只占30-40%。这一下子就和"直接作用内皮"的主流假设产生了张力。
进一步细分免疫群体,F4/80+巨噬细胞/单核细胞贡献了约60%的摄入。而在巨噬细胞中,CD11C+ MHCII+的间质巨噬细胞(IMs)占了近70%,肺泡巨噬细胞(AMs)贡献很小。结合免疫荧光——IMs确实紧贴vWF阳性大血管分布,而单核细胞则更远离血管——“EVP→IM→内皮"这条链条开始浮现。
体外实验也佐证了这一点:B16F10 EVPs直接处理人肺动脉内皮细胞(HPAECs),渗漏无变化。说明EVPs对内皮是"隔山打牛”。
那么谁才是真正的执行者?他们用抗体分别耗竭了AMs、IMs、中性粒细胞和单核细胞。结果很清晰:耗竭IMs大幅降低EVP诱导的渗漏(>80%),而耗竭其他群体效果微弱。IM耗竭同时减少了转移负担、延长了生存期。
@方法论点评:“耗竭-回复"实验是免疫学中确立细胞类型功能的经典手段。作者耗竭四种细胞后做比较,相当于做了平行功能筛选,避免了"发现X群体摄入EVP→直接认定X是效应细胞"的逻辑跳跃。值得注意的是,耗竭单核细胞仍有小部分降低渗漏,说明后续细胞浸润可能有协同作用,但IMs是主力。
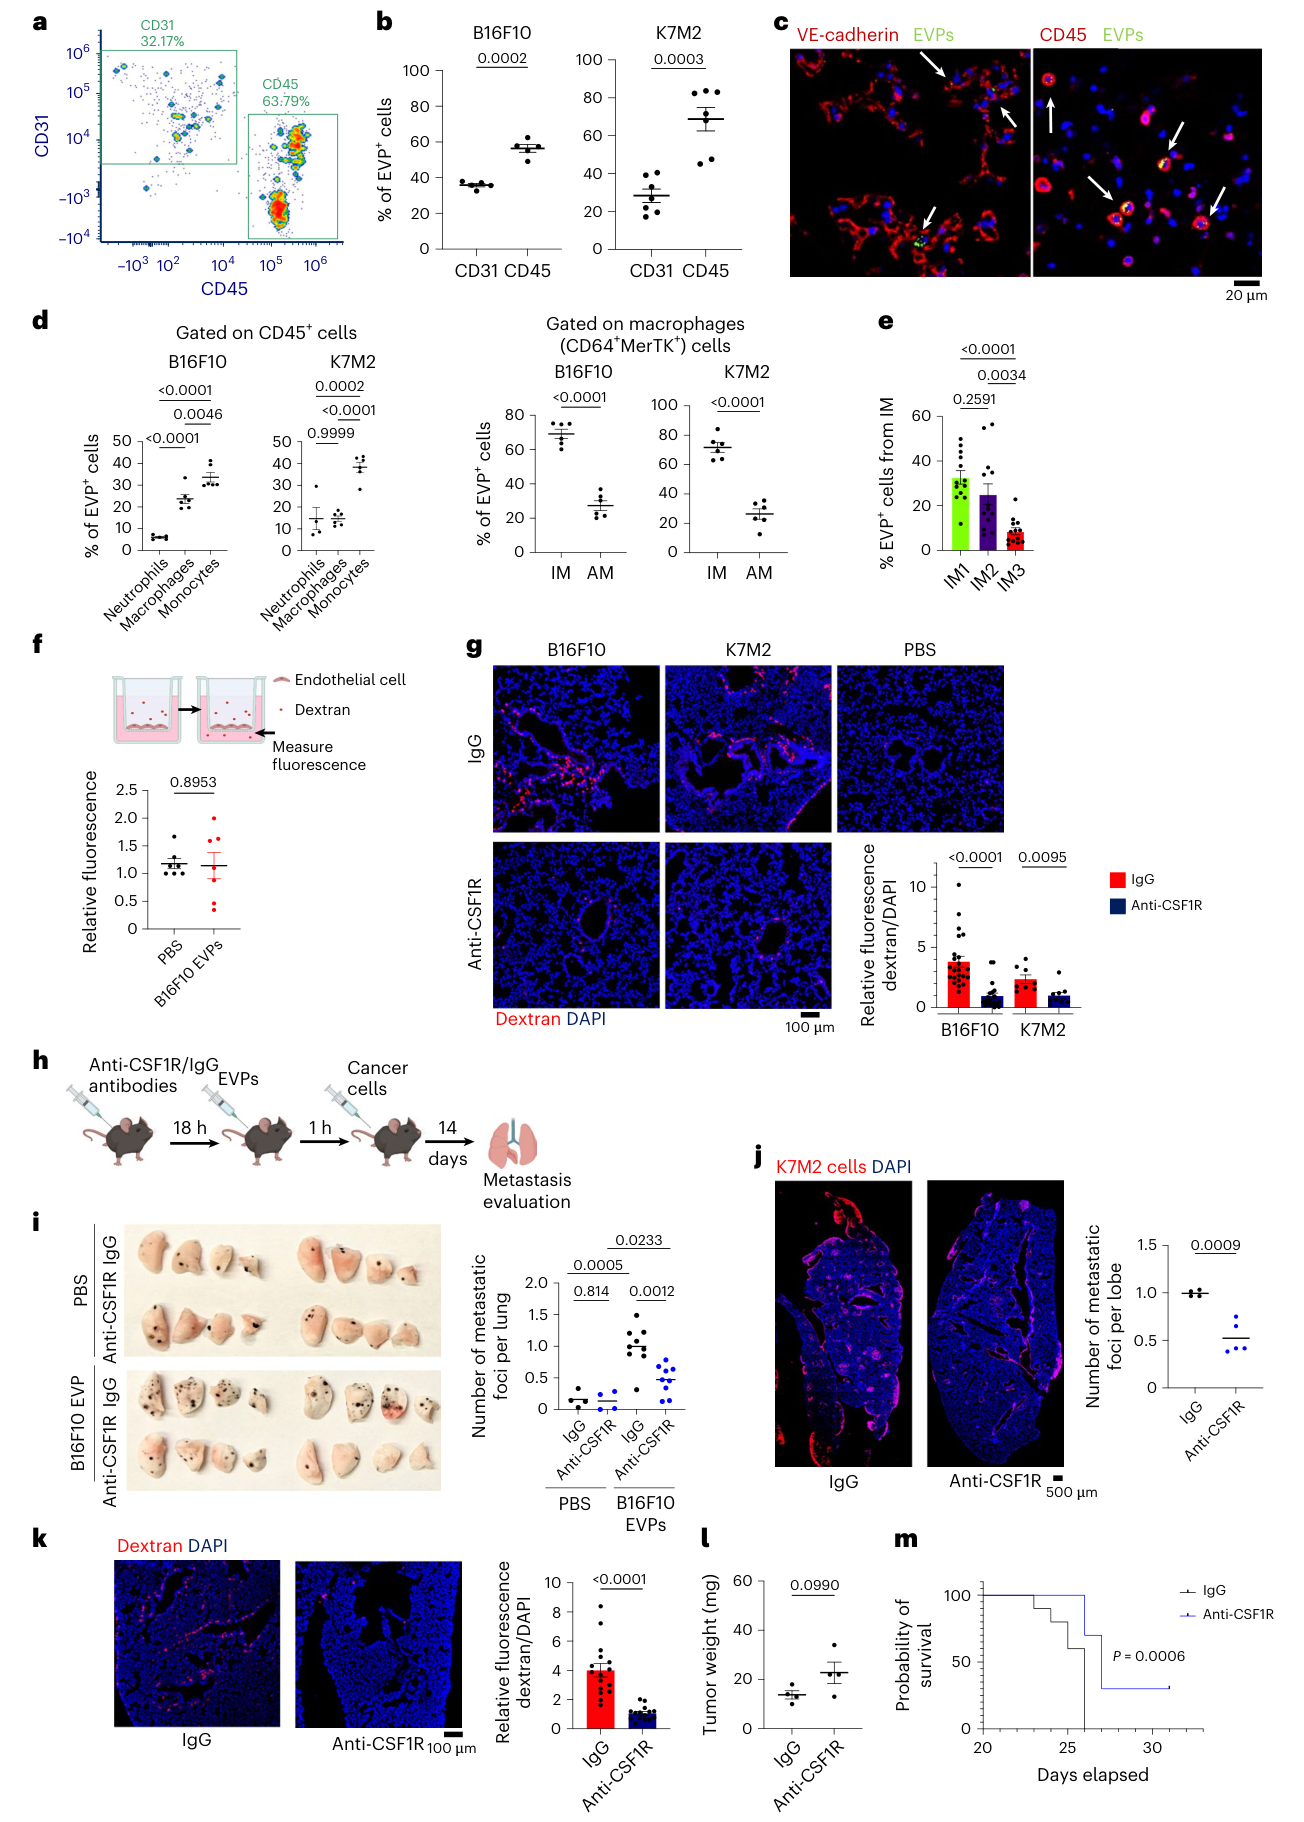
Fig. 3. Lung vascular leakiness is mediated by IMs. a–d, B16F10 and K7M2- derived EVPs were labeled with PKH67; PBS and dye only served as controls. The EVPs (10 µg) were injected retro-orbitally and, 1 h later, the lungs were extracted and analyzed by flow cytometry. a, Representative image of flow cytometry analysis of EVP+ cells from total live cells. Data were derived from n = 5 mice, across two independent experiments. b, Flow cytometry analysis of the percentages of EVP+CD31+ ECs and EVP+CD45+ immune cells from total EVP+ cells. Data represent the mean ± s.e.m., analyzed using an unpaired two-sided t-test with Welch’s correction. Data were derived from n = 5 and 7 mice for B16F10 and K7M2, across three independent experiments. c, Representative image of immunofluorescence analysis. DAPI-stained nuclei appear in blue. Lung tissues exhibit expression of VE-cadherin (left) and CD45 (right) (both in red), EVPs (green) and DAPI (blue). Data were derived from n = 3 mice, from one independent experiment. Scale bar, 20 µm. d, Flow cytometry analysis of percentages of EVP+ cells in different immune populations. Data represent the mean ± s.e.m., analyzed using a one-way ANOVA with Šídák’s multiple- comparison test (left) and an unpaired t-test with Welch’s correction (right) (IM/AM). Data were derived from n = 6 mice for macrophages, monocytes, IMs and AMs, n = 4 mice for neutrophils B16F10 and n = 5 mice for neutrophils K7M2, across three independent experiments. e, Flow cytometry analysis of percentages of EVP+ cells in different IM subpopulations. Data represent the mean ± s.e.m., analyzed using a one-way ANOVA with Šídák’s multiple- comparison test. Data were derived from n = 13 mice, across three independent experiments. f, Top, Schematic illustration of in vitro permeability experiment. Bottom, Effect of B16F10/PBS EVPs on the permeability of HPAEC monolayers according to an in vitro permeability assay. Data represent the mean ± s.e.m., analyzed using an unpaired t-test with Welch’s correction. Data were derived from n = 7 wells across two independent experiments. g, Representative images (left) and associated statistical analysis (right) of in vivo vascular permeability determined by the appearance of intravenously injected dextran (red).(图注取自PDF文本层,来源:Nature Cancer, 2026)
第四步:IMs分泌IL-6,渗漏的真正"钥匙”
那IMs被EVP激活后,到底释放了什么?
他们分离出IMs,用B16F10 EVPs处理3小时,然后将条件培养基(CM)加到内皮细胞上,CM显著提高了内皮通透性——这意味着IMs确实分泌了某种可溶性因子。
RNA-seq显示,EVP+ IMs中IL-6-JAK-STAT3、TNF-NF-κB和炎症通路显著富集。而M2标记物(CD206、Retnla等)下调,M1标记物上调,提示IMs向促炎状态转变。
接下来是关键:他们用细胞因子芯片和qPCR逐一验证,发现B16F10和K7M2 EVPs能强烈诱导IL-6、CXCL2、CCL3和TNF的表达,而4T1和Melan-A EVPs几乎无变化。然后用中和抗体挨个阻断,只有抗IL-6能显著降低两种模型中的血管渗漏。重组IL-6本身也能诱导渗漏,且在IM耗竭小鼠中,补上IL-6能恢复渗漏——说明IL-6是IMs作用于内皮的关键下游信号。
IL-6处理内皮细胞后,VE-cadherin和ZO-1排列松散,细胞骨架重排,这与经典血管通透性增高的形态一致。最后,抗IL-6中和抗体也能显著减少EVP诱导的转移。
@方法论点评:从"CM能渗漏"到"芯片筛因子"再到"中和抗体逐个验证",这是一条从功能到分子的标准解构路径。特别重要的是,他们验证了阻断IL-6能在IM耗竭背景下回复渗漏——这就把"IM→IL-6→内皮"的上下游关系钉死了。
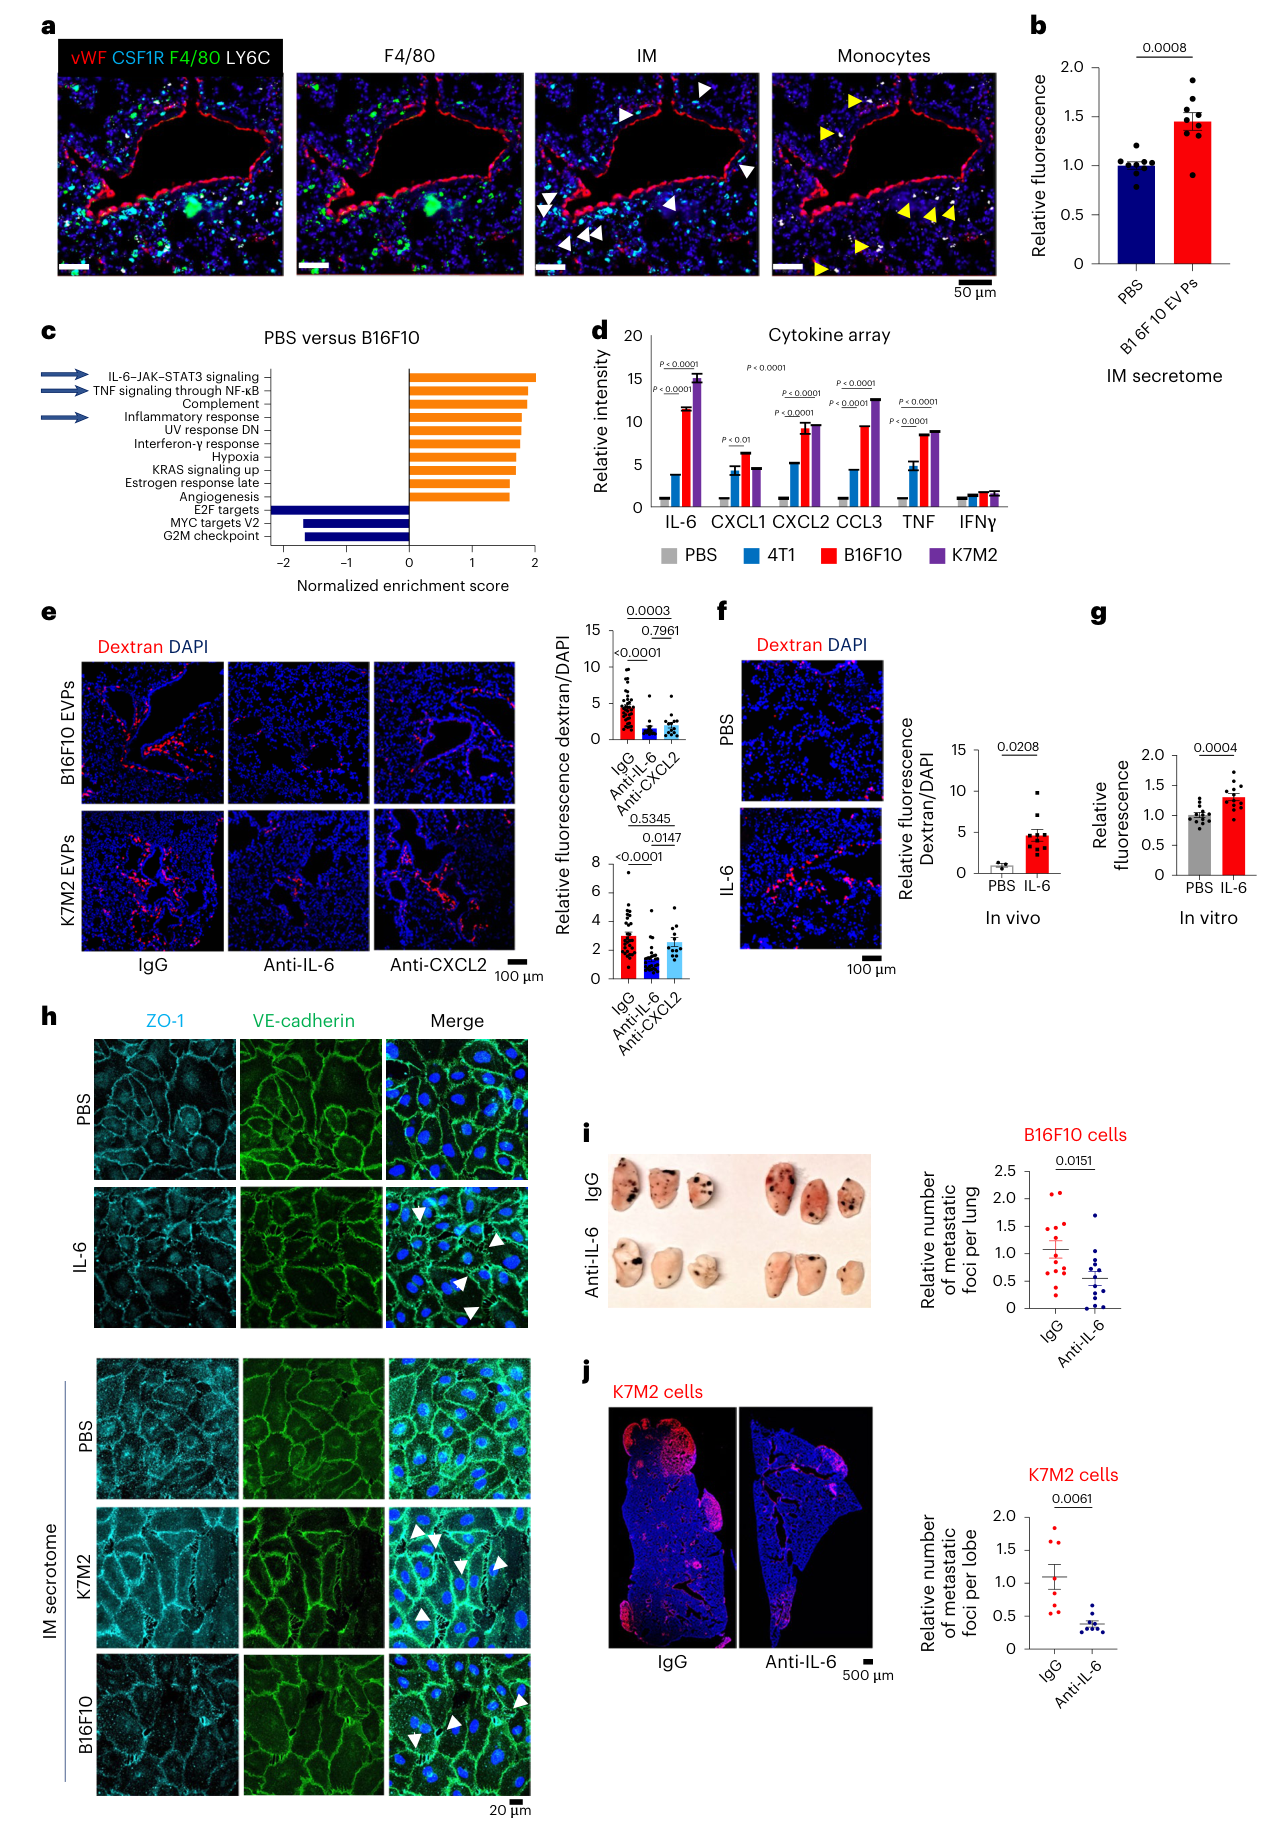
Fig. 4. IL-6 secretion by IMs enhances vascular permeability. a, Immuno fluorescence analysis of lung sections stained for vWF (red), CSF1R (cyan) F4/80 (green), monocyte marker Ly6C (white) and DAPI (blue). White arrows indicate IMs (F4/80+CSF1R+Ly6C− cells) localized in close proximity to vWF- positive vessels. Yellow arrows indicate monocytes (F4/80+Ly6C+) that localize farther away from the blood vessels. Data were derived from n = 3 mice, from one independent experiment, Scale bar, 50 µm. b, The effect of B16F10- treated IM secretome on the permeability of HPAEC monolayers assessed by an in vitro permeability assay. Data represent the mean ± s.e.m., analyzed using an unpaired t-test with Welch’s correction. Data were derived from n = 3 independent experiments, with three wells per group. c, GSEA of the common differentially expressed genes using Hallmark gene sets, showing significantly changed signaling pathways with false discovery rate (FDR) < 0.1. NES, normalized enrichment score. d, Analysis of cytokine array of the secretome from IMs 3 h after treatment with B16F10/K7M2/4T1 EVPs or PBS. Data represent the mean ± s.e.m., analyzed using a one-way ANOVA. Secretome data were collected from IMs isolated from four different mice and combined together in one individual experiment. e, Representative images (left) and associated statistical analysis (right) of in vivo vascular permeability determined by the appearance of intravenously injected dextran (red). DAPI-stained nuclei appear in blue. Data represent the mean ± s.e.m., analyzed using an unpaired t-test with Welch’s correction. For B16F10, data were derived from 38, 16 and 14 images for IgG, IL-6 and CXCL2, respectively, from n = 8 mice for IgG and n = 4 mice for IL-6 and CXCL2, across two independent experiments. For K7M2, data were derived from 30, 27 and 12 images for IgG, IL-6 and CXCL2, respectively, from n = 8 mice for IgG and IL-6 and n = 4 mice for CXCL2, across two independent(图注取自PDF文本层,来源:Nature Cancer, 2026)
第五步:ITGa5——EVP上的"破坏开关"
但同样被巨噬细胞摄入,为什么4T1和Melan-A的EVPs不诱导IL-6?他们用质谱比较了高渗漏(B16F10、K7M2)和低渗漏(4T1、Melan-A)EVPs的蛋白质组,通路分析富集到了黏附相关通路。其中ITGa5、CDH2、NCAM1在高渗漏EVPs中显著富集。
敲除验证:CDH2和NCAM1敲除对渗漏无影响,唯独ITGa5敲除大幅降低了渗漏。反过来,在低渗漏的67NR细胞中过表达ITGa5,EVP致渗漏能力和转移能力双双上升。
关键问题:ITGa5到底帮助了"进细胞"还是"发信号"?敲除ITGa5不影响EVP的粒子数、大小、形态、经典标志物,也不影响EVP被IMs摄入。用ITGa5特异性抑制剂AV3处理后,EVP摄入仍不受影响,但渗漏显著降低。这说明ITGa5不是"门卡",而是"信号开关"。
那么下游是什么?ITGa5 KO EVPs处理后,IMs中IL-6-JAK-STAT3和NF-κB通路的激活大幅减弱。ITGa5抑制后,p-IKKβ/α降低、p65核转位减少,NF-κB报告基因活性下降。用TPCA-1抑制NF-κB后,IL-6分泌减少、内皮渗漏降低。时间动力学显示,EVPs先激活IKKβ(NF-κB通路,10-30分钟),随后是STAT3(1-4小时),提示NF-κB在先,STAT3在后或协同。
@方法论点评:这里体现了层层递进的精细机制探究:从质谱发现候选分子 → 功能验证(KO/OE)→ 区分"摄取"与"信号"功能(AV3不影响摄取)→ 通路定位(NF-κB)→ 时序(IKK先于STAT3)。每一步都有一个明确的假设和对应的排除方案。
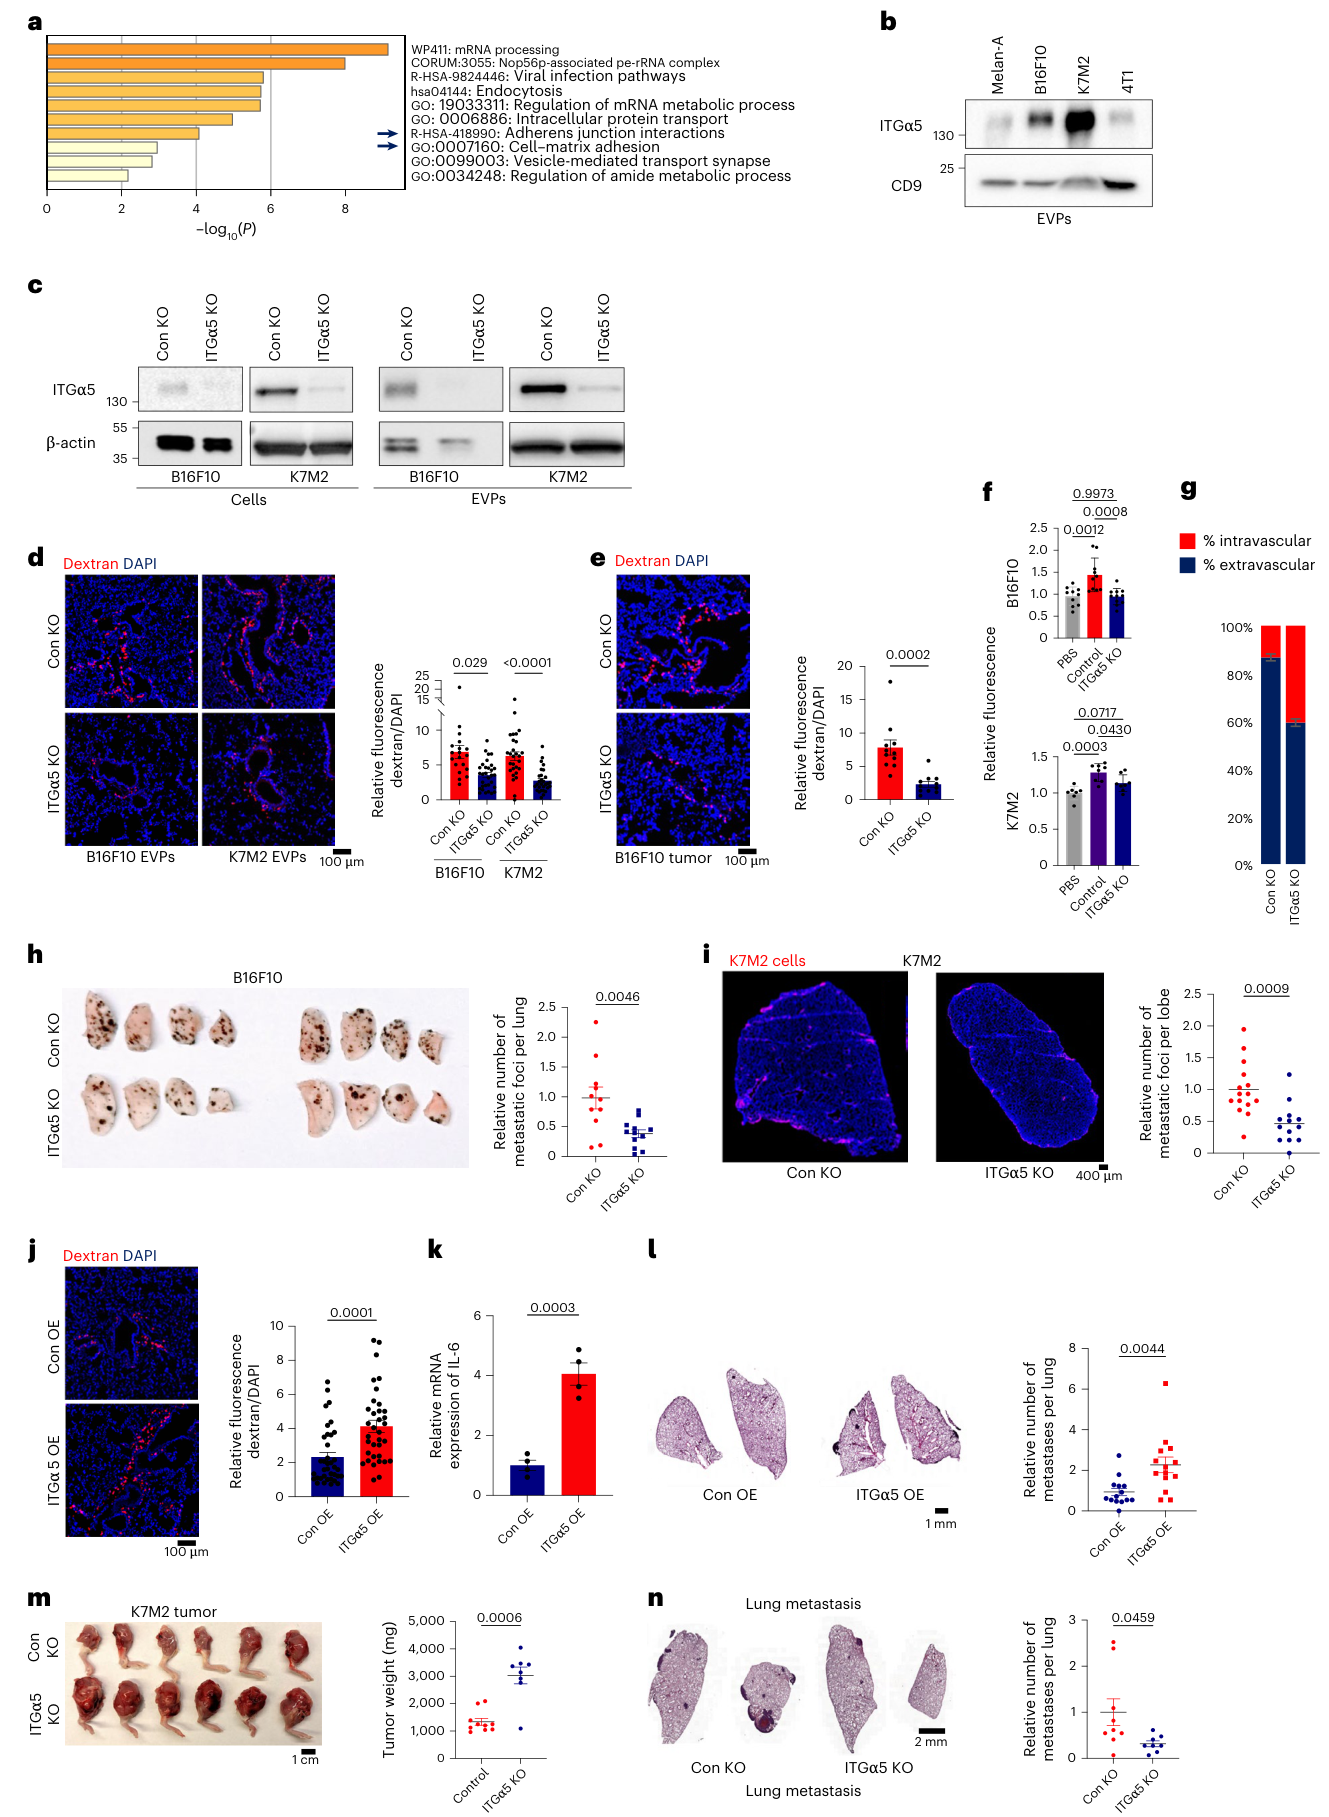
Fig. 5. ITGα5 in EVPs induces vascular leakiness and metastasis. a, Pathway analysis of proteins shared between B16F10 and K7M2 EVPs and absent in Melan-A and 4T1 EVPs. b, Western blot analysis of ITGα5 in EVPs from different cancer cell lines. CD9 was used as a loading control. Data were derived from n = 2 independent experiments. c, Western blot analysis of ITGα5 expression in B16F10 and K7M2 EVPs derived from control or ITGα5-KO cells. Data were derived from n = 2 independent experiments. d, Representative images (left) and associated statistical analysis (right) of in vivo vascular permeability. DAPI-stained nuclei appear in blue. Data represent the mean ± s.e.m., analyzed using an unpaired t-test with Welch’s correction. For B16F10, data were derived from 19 and 31 images for control and ITGα5-KO cells, with n = 6 mice for each group, across two independent experiments. For K7M2, data were derived from 28 and 29 images for control and ITGα5-KO cells, with n = 6 mice for each group, across two independent experiments. Scale bar, 100 µm. e, Representative images (left) and associated statistical analysis (right) of in vivo vascular permeability. DAPI-stained nuclei appear in blue. Data represent the mean ± s.e.m., analyzed using an unpaired t-test with Welch’s correction. For B16F10, data were derived from 11 images for each group, with n = 4 mice for each group, across one independent experiment. f, Effect of control and ITGα5-KO EVPs on the permeability of HPAEC monolayers assessed by an in vitro permeability assay. Data represent the mean ± s.e.m., analyzed using a one-way ANOVA with Šídák’s multiple-comparison test. For B16F10, data were derived from n = 10, 10 and 11 wells for PBS, control and ITGα5-KO cells, across three independent experiments. For K7M2, data were derived from n = 12, 16 and 14 wells for PBS, control and ITGα5-KO cells, across three independent experiments. g, Quantification of the percentage of B16F10 cells extravasating into the tissue relative to the total cell count, following education with control and ITGα5-KO EVPs. Data represent the mean ± s.e.m, analyzed using unpaired two-sided t-test with Welch’s correction. Data were derived from n = 6 control mice and n = 4 ITGα5-KO mice, across two independent experiments. h, Representative imaging of mouse lungs at 2 weeks after tail-vein injection of 50,000 B16F10 cells (left) and associated statistical analysis for number of metastases (right). Data represent the mean ± s.e.m.,(图注取自PDF文本层,来源:Nature Cancer, 2026)
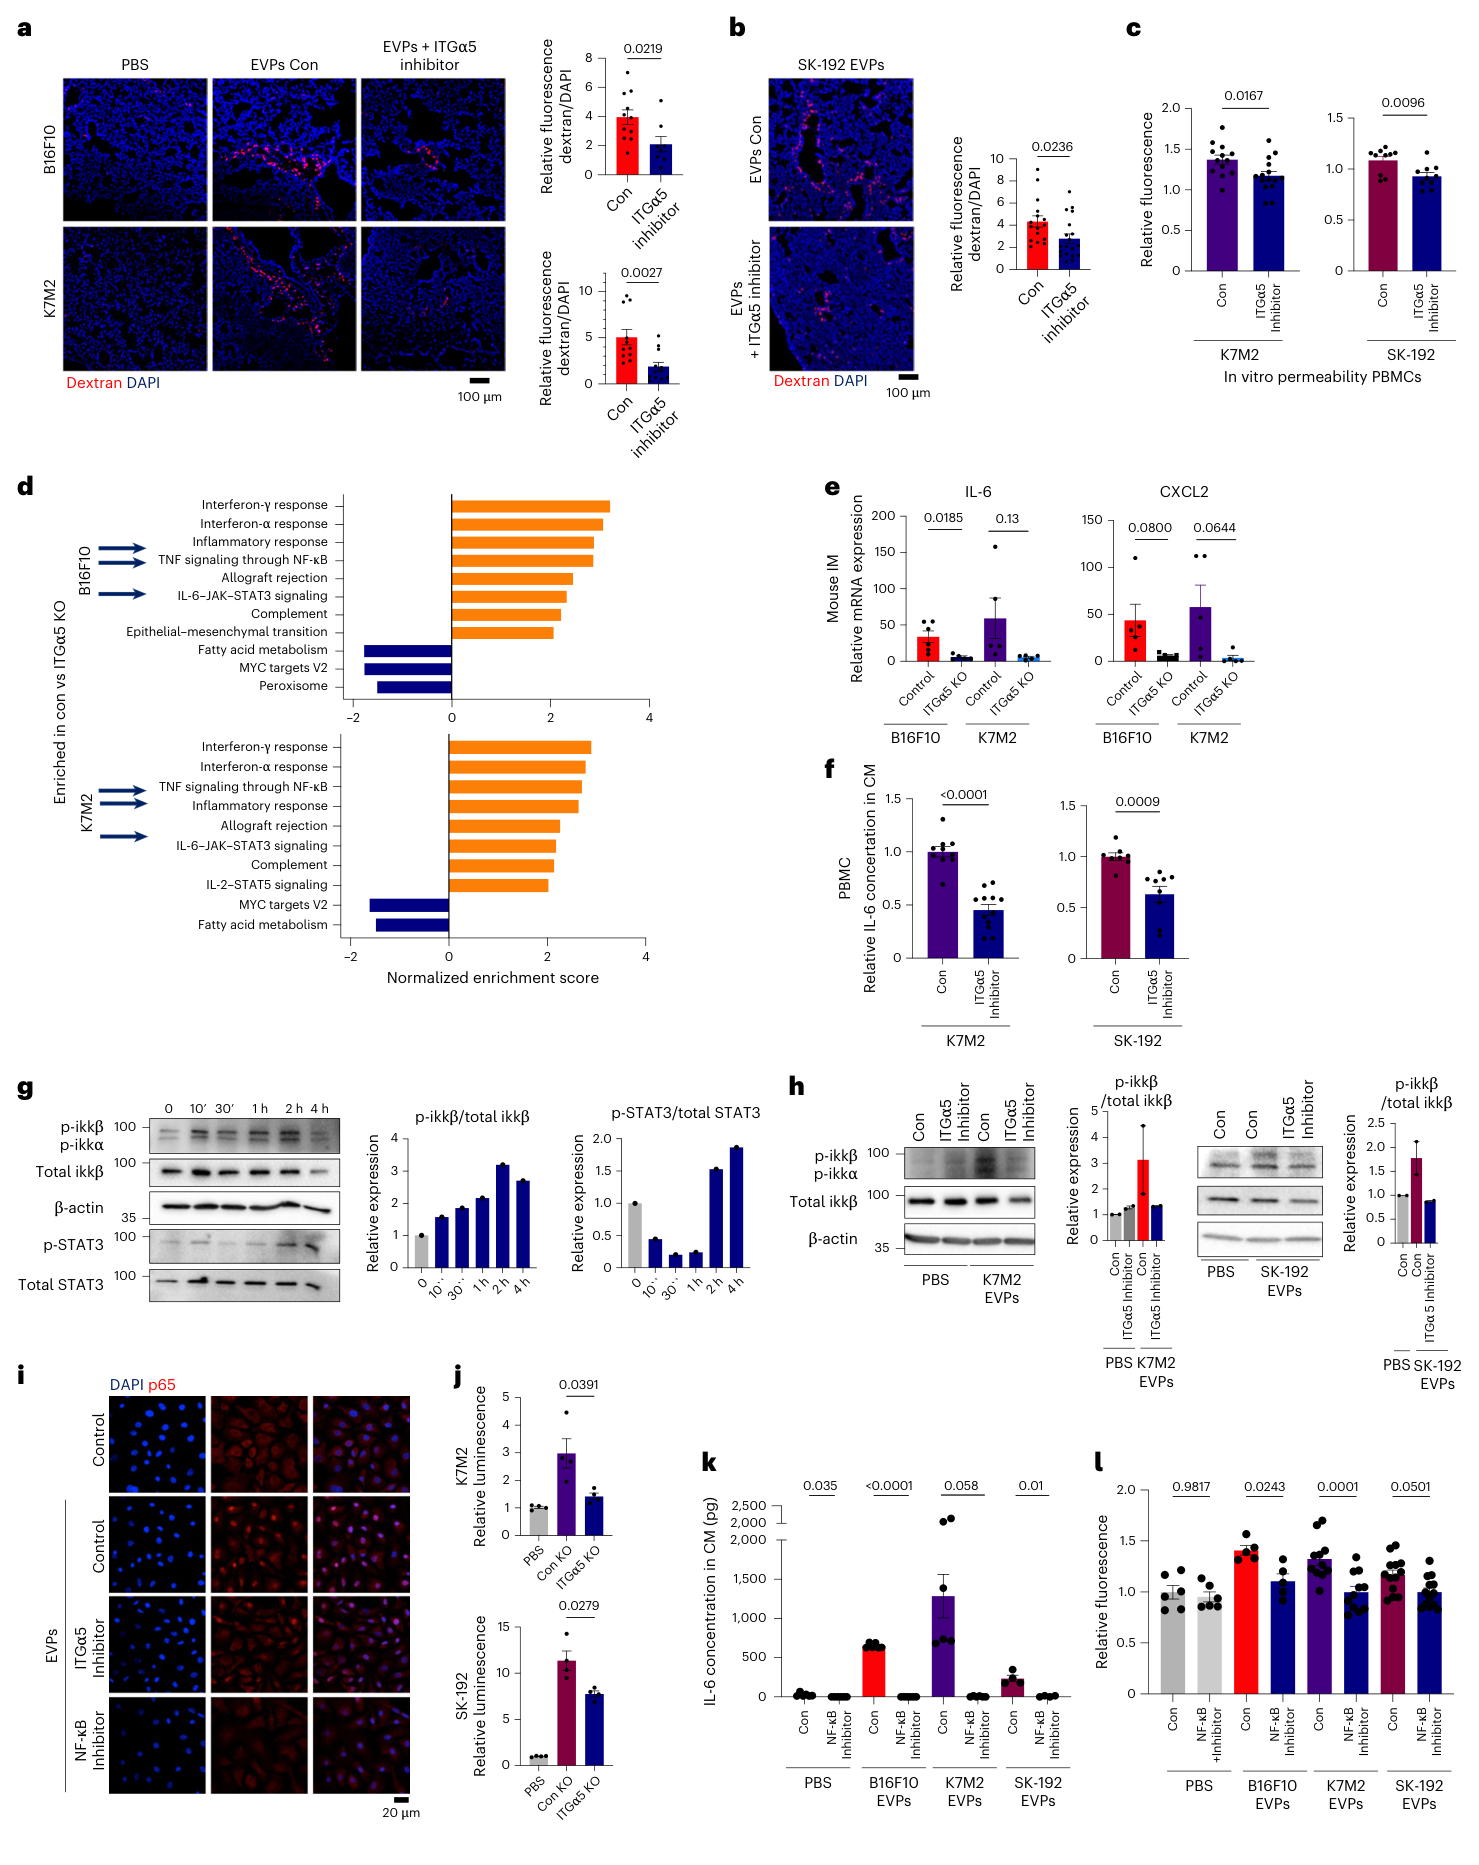
Fig. 6. ITGα5 in EVPs induces vascular leakiness through the activation of NF-κB signaling. a,b. Representative images (left) and associated statistical analysis (right) of in vivo vascular permeability after EVP treatment with AV3. DAPI-stained nuclei appear in blue. Data represent the mean ± s.e.m., analyzed using an unpaired t-test with Welch’s correction. For B16F10, data were derived from 8 and 11 images for control and inhibitor, with n = 3 mice for each group. For K7M2, data were derived from 11 and 12 images for control and inhibitor, with n = 3 mice for each group. For SK-192, data were derived from 16 and 19 images for control and inhibitor, with n = 5 mice for each group, across two independent experiments. Scale bar, 100 µm. c, Effect of AV3, an ITGα5 inhibitor, on the permeability of HPAEC monolayers according to an in vitro permeability assay. Data represent the mean ± s.e.m., analyzed using an unpaired t-test with Welch’s correction. For K7M2, data were derived from n = 13 and 15 wells for control and AV3, across four independent experiments, For SK-192, data were derived from n = 10 wells per group across three independent experiments. d, GSEA of the common differentially expressed genes using Hallmark gene sets, showing significantly changed signaling pathways with FDR < 0.1. e, RT–PCR analysis from IMs treated with control or ITGα5-KO EVPs from B16F10 and K7M2 cells for 3 h. Data represent the mean ± s.e.m., analyzed using a paired t-test. For CXCL2, data were derived from n = 5 wells per group, across two independent experiments. For IL-6, data were derived from n = 6 wells for B16F10 control and n = 5 wells for B16F10 KO and K7M2 cells, across two independent experiments. f, Normalized amount of secreted IL-6 in macrophage medium, following EVP treatment with AV3. Data represent the mean ± s.e.m., analyzed using an unpaired t-test with Welch’s correction. For K7M2, data were derived from n = 10 and 12 wells for control and AV3, across four independent experiments. For SK-192, data were(图注取自PDF文本层,来源:Nature Cancer, 2026)
第六步:回到临床——结直肠癌EVPs验证
最后他们从25名结直肠癌患者中分离了肿瘤和癌旁组织来源的EVPs。肿瘤EVP中ITGa5蛋白水平显著更高,且能在体外诱导人巨噬细胞分泌更多IL-6,在体内也能诱导血管渗漏,而癌旁EVP几乎无效。TCGA数据也显示ITGa5高表达与多种癌症的较差生存相关。
@方法论点评:“临床样本验证"是这类研究的必要闭环——如果只在细胞系里玩,终归是模型生物学;有了患者来源的EVPs数据,结论才能站得更稳。
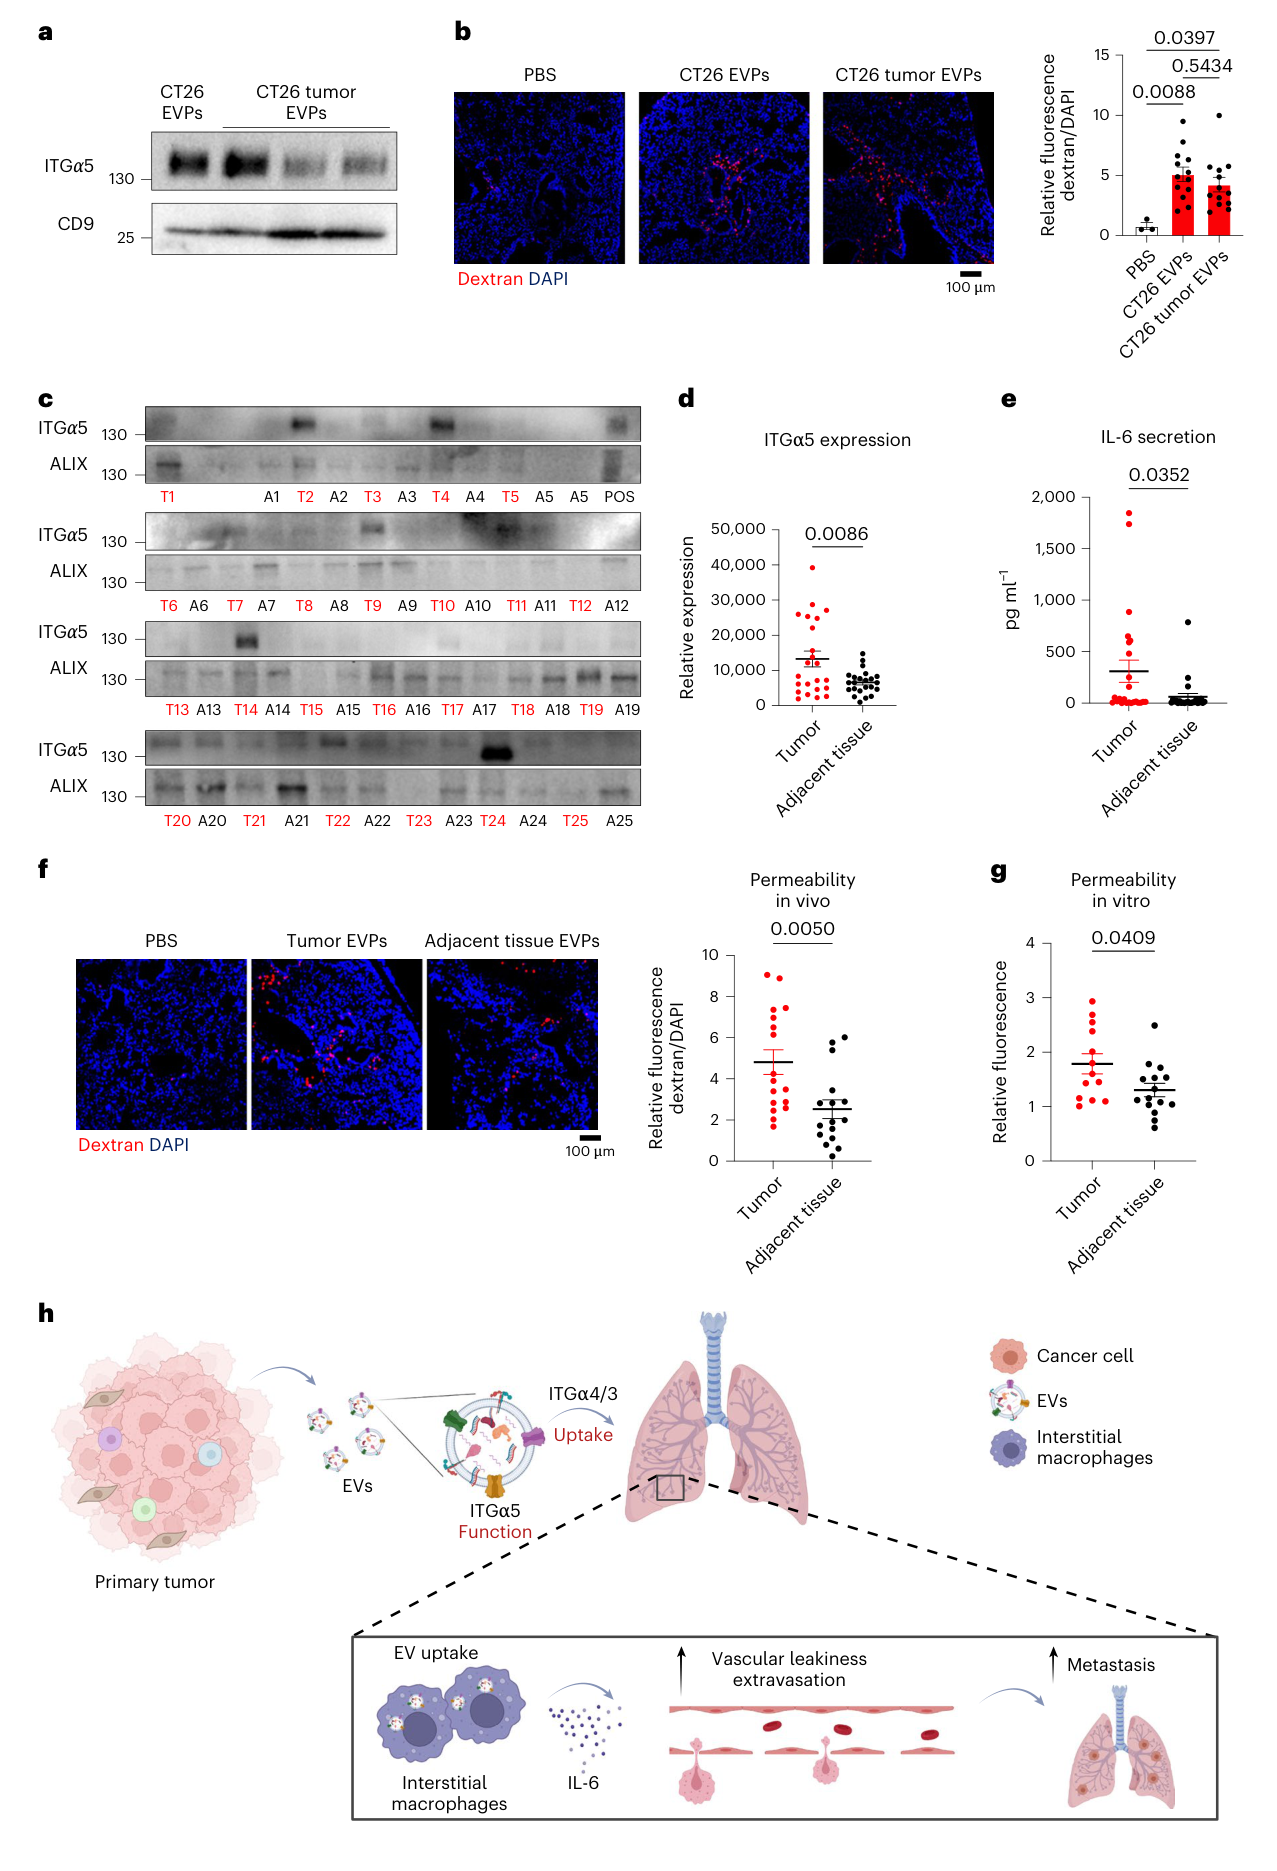
Fig. 7. Tumor-derived EVPs from colorectal cancer promote elevated ITGα5, IL-6 secretion and vascular permeability. a, Western blot analysis of ITGα5 expression in EVPs derived from CT26 colon cancer cells and tumor tissue explants. CD9 was used as a loading control. Data were derived from one independent experiment. b, Representative images (left) and associated statistical analysis (right) of in vivo vascular permeability. DAPI-stained nuclei appear in blue. Data represent the mean ± s.e.m., analyzed using an unpaired t-test with Welch’s correction. Data include 13 images per group, from n = 3 mice for each group, from one independent experiment. PBS was used as a control. c, Western blot analysis of ITGα5 in EVPs from 24 colon cancer tumors (black) and adjacent tissues (red). Alix was used as a loading control. Data were derived from one independent experiment. d, Relative expression of ITGα5 from the western blot analysis in Fig. 7c. Data represent the mean ± s.e.m., analyzed using an unpaired t-test with Welch’s correction. Data were derived from n = 25 samples in each group, from one independent experiment. e, IL-6 concentration in human macrophage medium following treatment with EVPs from colon cancer samples (tumor and adjacent tissue). Data represent the mean ± s.e.m., analyzed using an unpaired t-test with Welch’s correction. Data were derived from n = 25 samples(图注取自PDF文本层,来源:Nature Cancer, 2026)
核心结论
肿瘤EVP不是"破墙者”,而是"发令员"。EVP上的ITGa5直接作用于紧邻血管壁的间质巨噬细胞,通过NF-κB → IL-6 → 内皮VE-cadherin/ZO-1重排这一链条打开血管屏障,为循环中的肿瘤细胞提供外渗通道,从而促进转移。整个事件在1小时内就能启动,说明预转移微环境的准备比预想中更快。
对耐药/DTP/PGCC 的启示
微环境重编程的快速性:EVP→IM→IL-6信号在1小时内完成,提示靶向这一轴可能需要更早干预。在耐药/复发场景中,那些残留的DTP细胞可能持续释放低水平EVPs,长期"教育"局部巨噬细胞,为日后复燃创造有利微环境。 ITGa5作为"微环境开关"的潜力:DTP/PGCC往往处于非增殖或慢周期状态,但可能通过EVPs高表达ITGa5来"遥控"微环境,制造渗漏和免疫抑制。如果这一假设成立,那么检测循环EVP中ITGa5水平可能成为预测复发或耐药进展的早期标志物。 巨噬细胞极化的可塑性:文中显示IMs从"静息"转向"促炎"状态是EVP驱动的,而DTP/PGCC与肿瘤相关巨噬细胞的"共驯化"关系已有不少报道。本文明确了一个具体分子通路(ITGa5-NF-κB-IL-6),这为未来通过干预EVP-巨噬细胞互作来逆转耐药微环境提供了可操作的靶点。
局限
使用的基本是雌性小鼠,未系统对比性别差异。 IMs耗竭实验中,CSF1R抗体也会影响一些单核细胞来源细胞,因此"IM特异性"不能完全等同于"IM唯一性"。 未充分探讨ITGa5在EVP上发挥信号的直接受体/配体对,文中提到不依赖RGD-整合素结合的摄入,但也没有明确"信号"本身是通过何种共受体或间接机制激活的。 临床样本EVPs的功能实验受限于样本量和单一癌种,需更大队列和多癌种验证。
来源
期刊:Nature Cancer,2026。DOI: 10.1038/s43018-026-01209-z